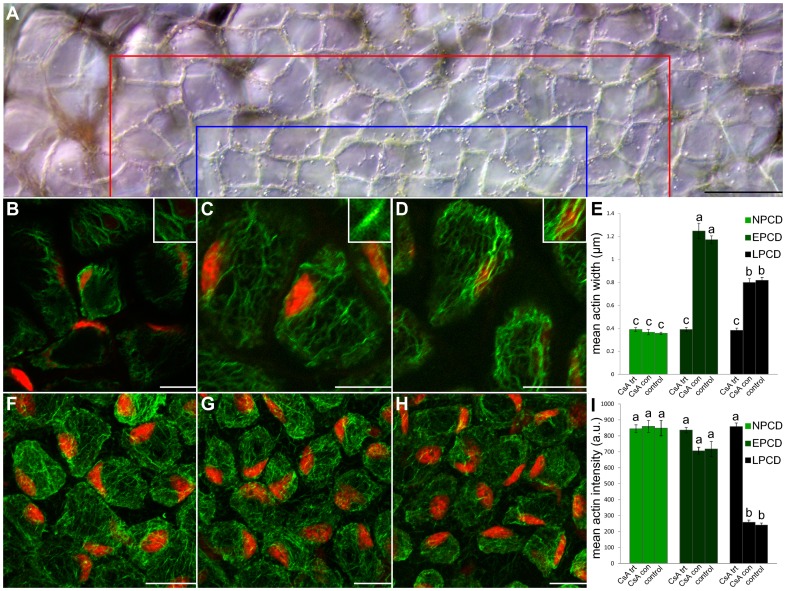
Figure 7. Actin dynamics following treatment with 10µM CsA for 3 days in sterile culture.
Cells within the lower portion of this figure (B–D and F–H) are stained with fluorescent Alexa Fluor 488 phalloidin (green) for actin and counterstained with propidium iodide (PI; red) for nuclei; tissues are fixed (A) A representative DIC micrograph of a half of a single areole of a window stage leaf following CsA treatment; note that the typical gradient of cell death is not present indicating a perforation will not form. Cells between the border of the image and the red line are representative NPCD cells, cells between the red line and the blue line are representative EPCD cells and cells between the blue line and the bottom of the image are representative LPCD cells. (B–D) Characteristic single z-stack micrographs of actin width within NPCD, EPCD and LPCD stage cells (0.39 µm; 0.39 µm; 0.38 µm, respectively; see insets) following CsA treatment. (E) CsA experimental data compared to non-treated leaves (control; data extracted from Figure 3) and treated controls (CsA con). (F–H) Representative maximum projection micrographs of actin intensity within NPCD, EPCD and LPCD stage cells (844.50 a.u., 836.31 a.u., 858.30 a.u. respectively) following CsA treatment. All actin intensity measurements were acquired within 1300 µm3 of maximum projected z-stacks tissue. (I) Mean actin intensities for each stage of PCD. Data for non-treated controls was extracted from Figure 3. All error bars are representative of standard error and all data represented by different letters are significantly different within individual graphs (P≤0.05 ANOVA). Scale bars (A) = 45 µm, (B–D and F–H) = 25 µm.

