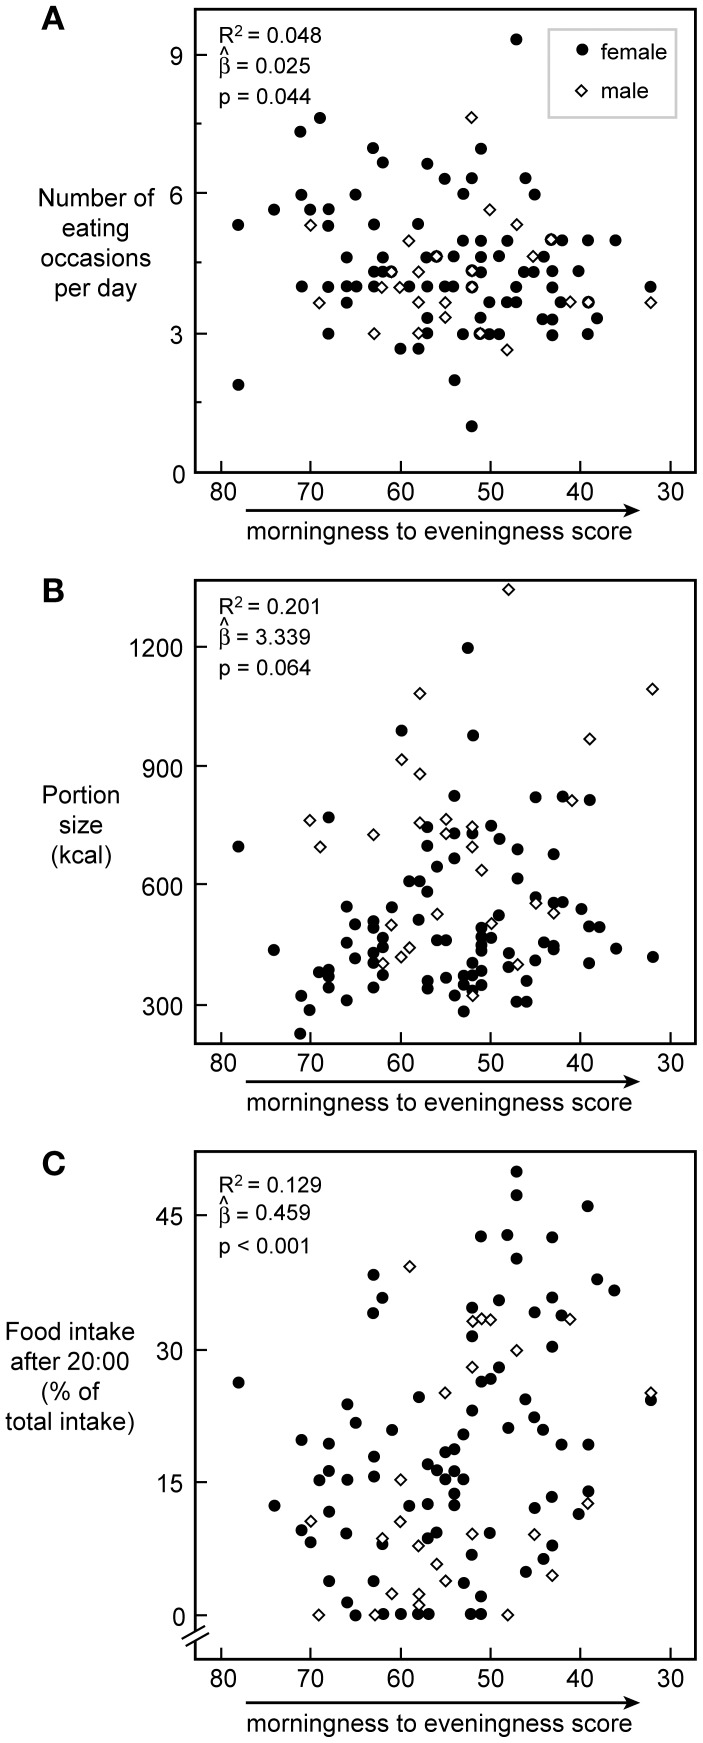
Figure 2. Pattern and timing of food intake vs. chronotype score.
Plot of chronotype scores versus the number of eating occasions (A), the portion size (B), and the amount of caloric intake after 20∶00 (C) with a trend line, respectively. N = 113 for all. R2, slope, and p-value for the prediction of chronotype score on food intake variables in each plot are calculated from gender-corrected models. Closed circles represent women, open diamonds represent men.

