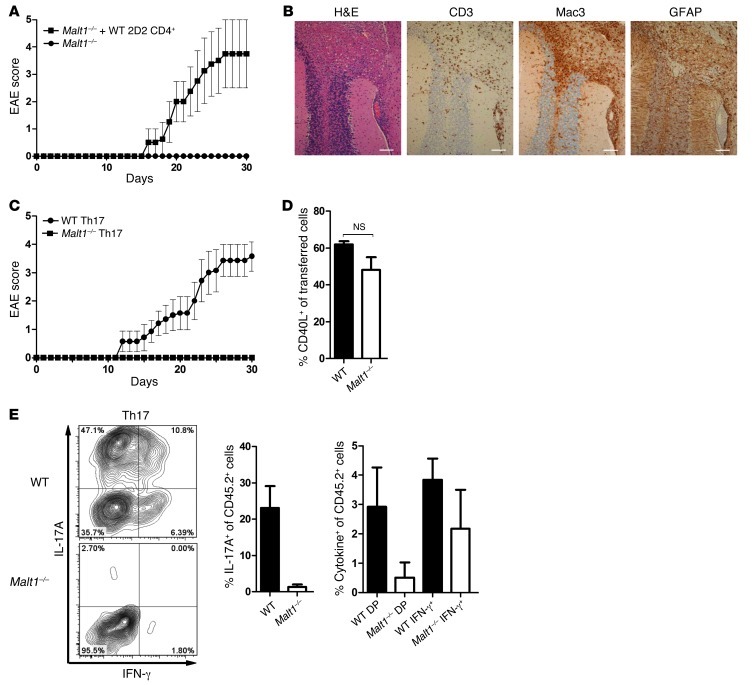
Figure 4. Malt1–/– Th17 cells are not encephalitogenic.
(A) Malt1–/– mice were injected with 1 × 10⁵ WT 2D2 CD4+ cells or PBS as control. EAE was initiated, and animals were monitored as in Figure 1A. Data (mean ± SEM) are representative of 2 independent experiments. (B) Histopathological analyses of CNS cross-sections from mice in A at 30 days after MOG injection, showing cerebellar white matter, cerebellar cortex, and leptomeningeal blood vessels. Brain sections were stained with H&E or immunostained to detect CD3 (T cells), Mac3 (macrophages), or GFAP (reactive astrocytes). Scale bars: 100 μm. Data are representative of 2 independent experiments. (C) EAE was initiated in Malt1–/– and WT mice by MOG injection. At 10 days after injection, CD4+ T cells from spleens and LNs were isolated and cultured for 5 days with MOG peptide, IL-23, and anti–IFN-γ before injection (2 × 10⁷ cells/mouse) into WT recipients (n = 7 per group). Recipients were injected with PT on the day of T cell transfer and 2 days thereafter. Mice were monitored daily as in Figure 1A. (D and E) Cells generated as in C were injected into transgenic CD45.1+ WT recipients. At day 18 after injection, mice were sacrificed, and CD4+CD45.2+ T cells from spleens and LNs were analyzed for CD40L surface expression (D) and IFN-γ and IL-17A production (E) by intracellular flow cytometry. DP, double IFN-γ/IL-17A producers. Data are mean ± SEM (n = 6).

