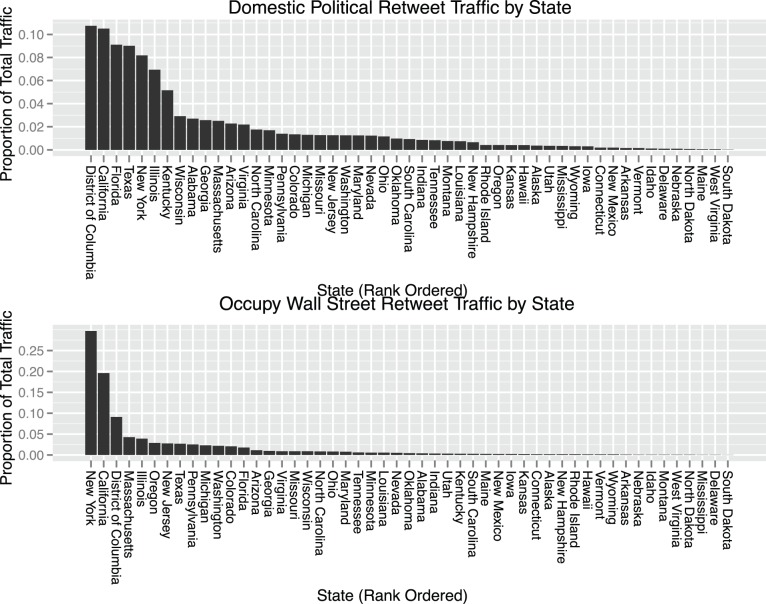
Figure 1. Proportion of retweet traffic associated with each state, for each content stream.
Ordered by the amount of traffic associated with each state, it is clear that a few high-profile locations serve as the dominant sources of content in the Occupy stream. This concentration stands in contrast to the more heterogeneous activity profile for the stream of domestic political communication.

