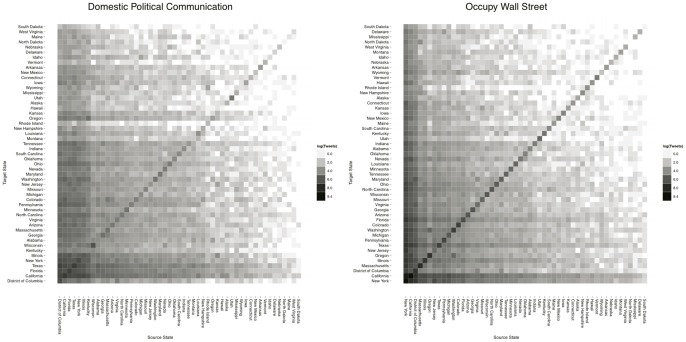
Figure 5. Connectivity matrices describing directed interstate communication volume.
The edge weight corresponding to each cell is mapped to a color hue on a logarithmic scale ranging from white for edges with the least weight to black for edges with the most weight. The strong diaonalization and limited off-diagonal mass apparent in the Occupy Wall Street matrix is indicative of highly localized communication activity.

