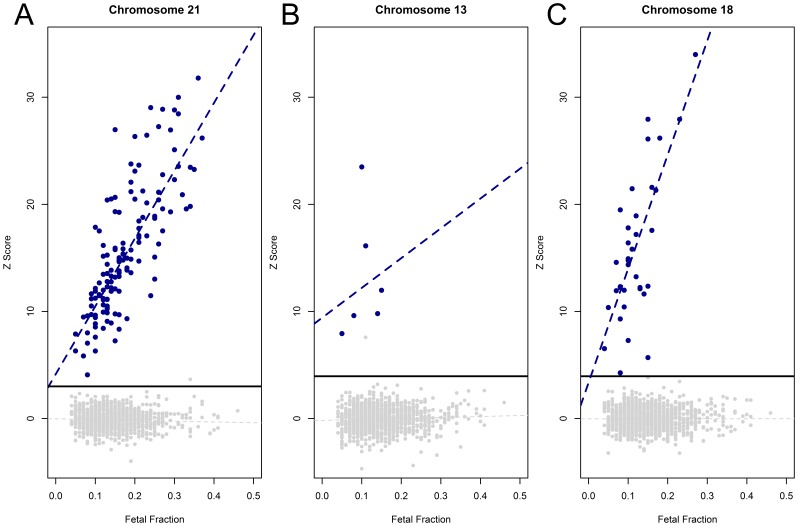
Figure 3. Z-score is linked to fetal fraction.
The chromosome specific z-score for each aneuploid chromosome is plotted against the proportion of fetal DNA (fetal fraction). Samples classified by karyotype analysis as trisomies for A) Chromosome 21, B) Chromosome 13, or C) Chromosome 18 are shown in blue; unaffected samples for each aneuploidy condition are shown in gray. Black horizontal line in each plot represents the respective classification cutoff for each chromosome (z = 3 for chromosome 21, z = 3.95 for chromosomes 13 and 18). Dashed blue line in each panel represents a robust linear fit of aneuploid samples. Dashed gray line in each panel represents a robust linear fit of all unaffected samples.

