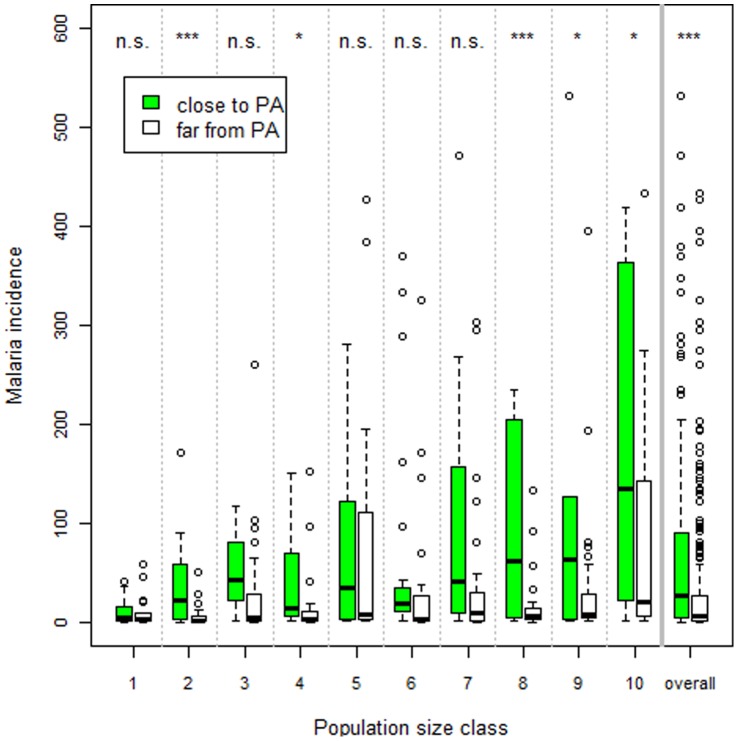
Figure 2. Malaria incidence tends to be higher for cities close to protected areas (PA’s).
Data were stratified into 10 percentile population size classes and average number of malaria cases per month for each city was depicted. Within each size class, we compare cities close (green box-plots) vs. distant from PA’s (white box-plots). Cities close to PA’s (i.e., indigenous lands, state and federal parks) are those whose catchment area intersected one or more PA’s. ‘n.s’, ‘*’, ‘**’, and ‘***’ are non-significant (p>0.05), significant (0.01<p<0.05), very significant (0.001<p<0.01) and highly significant (p<0.001) difference in means, respectively, based on permutation tests.

