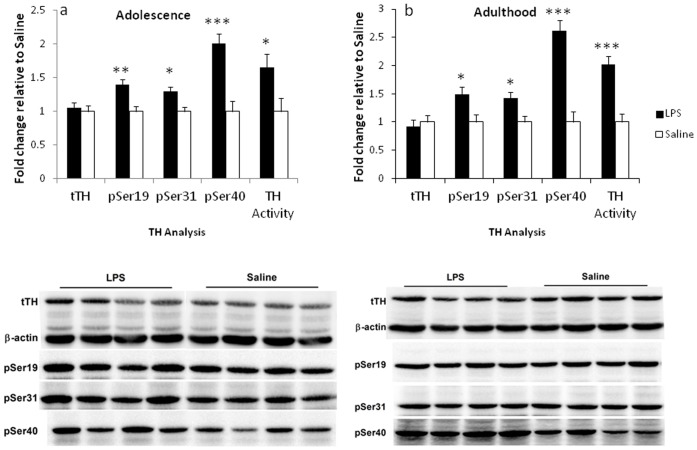
Figure 5. Effect of neonatal LPS exposure on TH protein, phosphorylation at Ser19, Ser31, Ser40 and TH activity levels.
Changes in TH are expressed as a fold change relative to the saline control in the adrenal glands in adolescence (PND 50) (A) and adulthood (B). Representative immunoblots demonstrate the effect of LPS and saline treatments. Filled bars represent neonatally-treated LPS rats, hollow bars represent neonatally-treated saline controls. Values are mean±SEM. *p<.05, **p<.01, ***p<.001.

