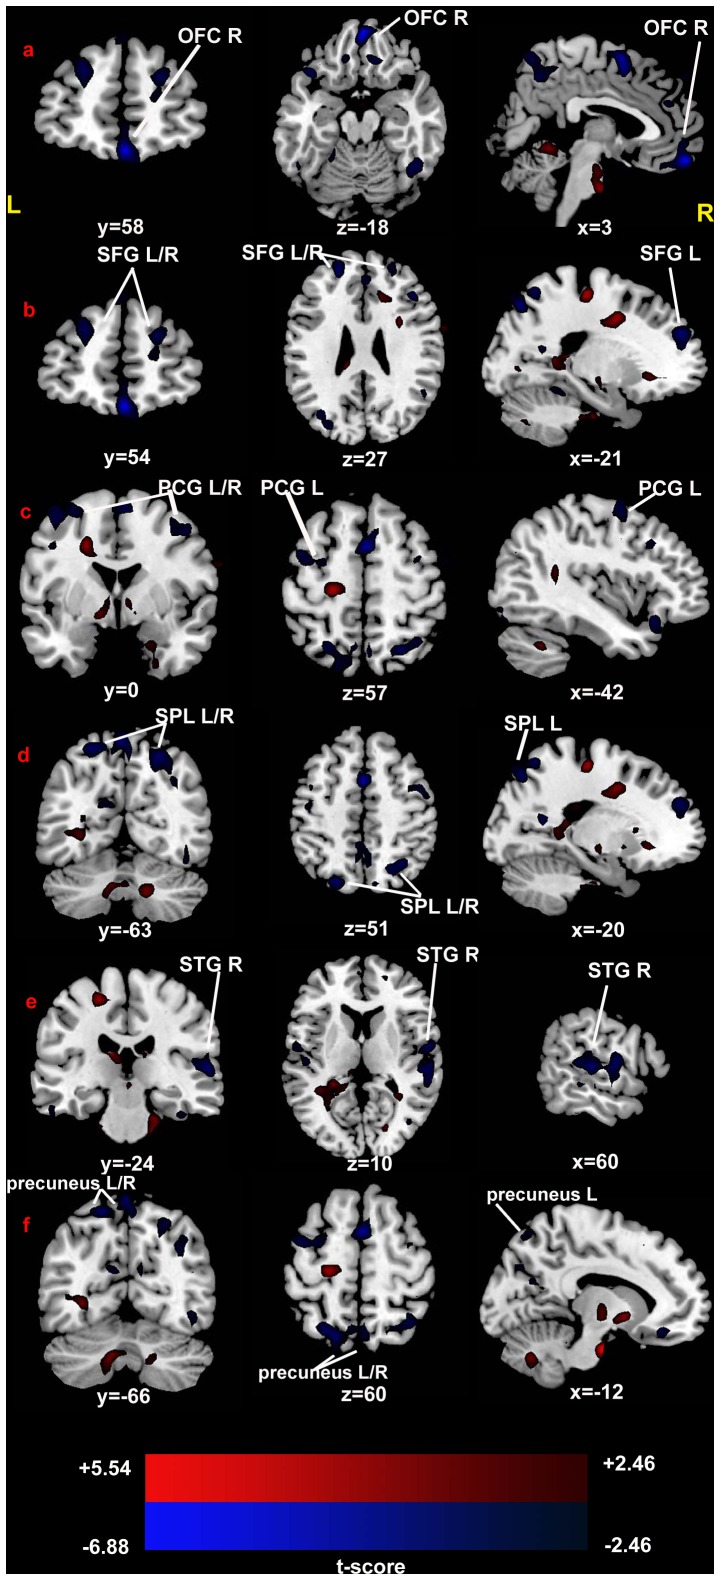
Figure 1. T-statistical different maps between the PBD patients and healthy controls (two-sample t test; P<0.05, corrected).
Hot and cold colors indicate increased and decreased ReHo, respectively. T-score bars are shown at the bottom. The numbers beneath the images represent MNI coordinates. Abbreviation: OFC, orbitofrontal cortex; SFG, superior frontal gyrus; PCG, precentral gyrus; SPL, superior parietal lobe; STG, superior temporal gyrus; L, left; R, right.

