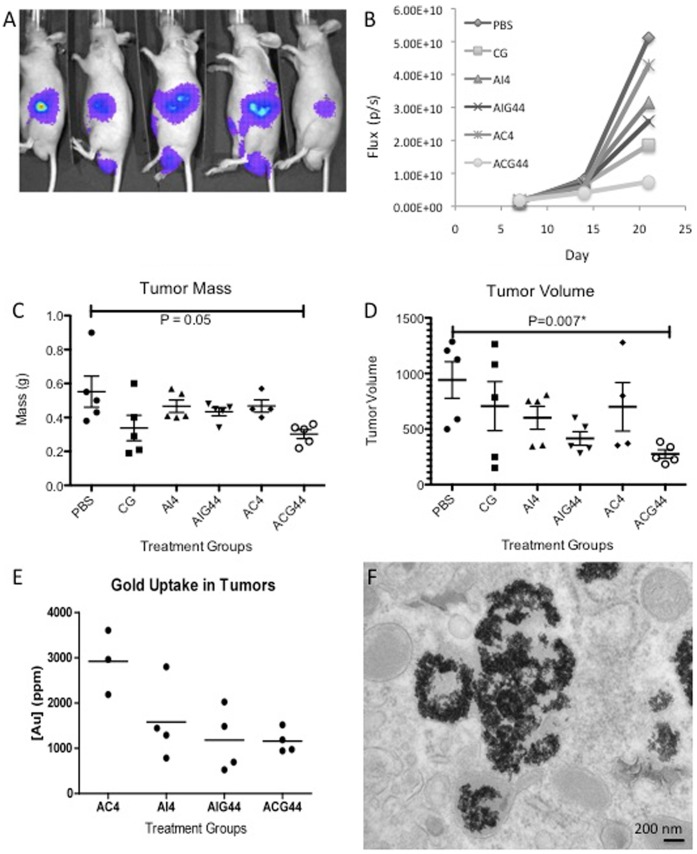
Figure 3. In vivo effects of gold nanoconjugates in an orthotopic model of pancreatic cancer.
Figure 3A shows a representative bioluminescence image of 5 mice, 7 days after orthotopic implantation of AsPC-1 cells into the pancreas. Figure 3B is flux quantification from the bioluminescence imaging taken every 7 days. Figure 3C, 3D and 3E all show scatter plots of tumor analysis of each animal per group, post study termination. Figure 3C shows tumor mass, 3D shows tumor volume determined through caliper measurements and 3E shows total gold uptake in each tumor determined by INAA. Figure 3F is a TEM micrograph showing ACG44 conjugates in a cross section of tumor tissue.

