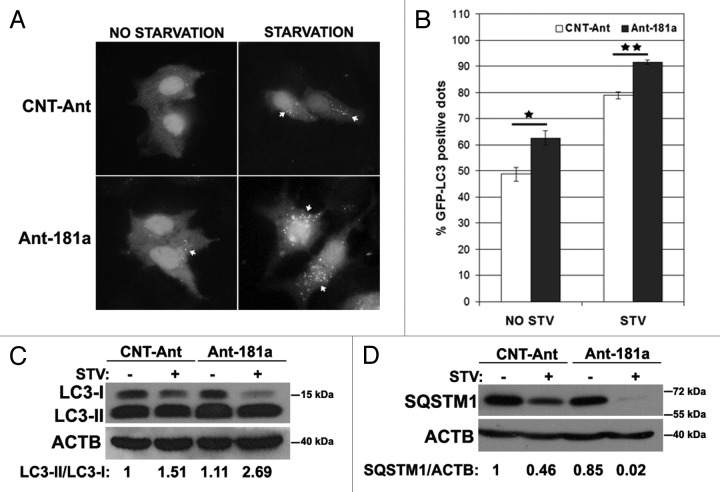
Figure 3. Inhibition of endogenous MIR181A using antagomirs (Ant-181a) stimulated autophagic activity. (A) Ant-181a enhanced starvation-induced GFP-LC3 dot formation. CNT-Ant, control antagomirs. (B) Quantitative analysis of the experiments in (A). NO STV, No starvation. STV, starvation for 20 min. (mean ± SD of independent experiments, n = 3, *p < 0.05, **p < 0.01). (C) Ant-181a, but not CNT-Ant stimulated starvation (STV, 4 h)-stimulated LC3-I to LC3-II conversion in MCF-7 cells (n = 4). LC3-II/LC3-I densitometric ratios are marked. (D) Ant-181a, but not CNT-Ant resulted in the stimulation of SQSTM1 protein degradation following starvation (4 h) in MCF-7 cells (n = 3). SQSTM1/ACTB ratios are marked.

An official website of the United States government
Here's how you know
Official websites use .gov
A
.gov website belongs to an official
government organization in the United States.
Secure .gov websites use HTTPS
A lock (
) or https:// means you've safely
connected to the .gov website. Share sensitive
information only on official, secure websites.
