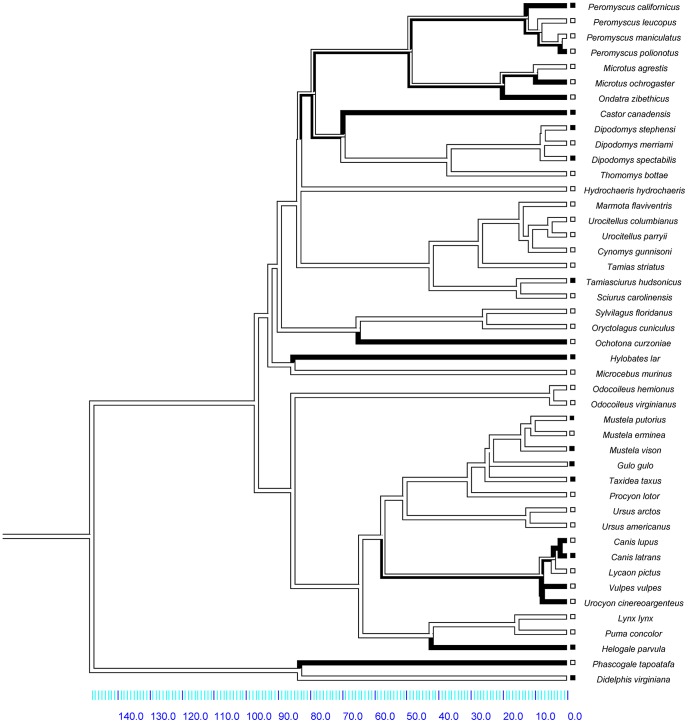
Figure 1. Phylogeny used for the analysis of the mammalian dispersal distance dataset.
Time is shown in millions of years. Social mating system is traced over the branches; social non-monogamy (the ancestral state) is represented by white branches and social monogamy is represented by black branches. The boxes represent character states for sex-biased dispersal, with white boxes for species with MBD and black boxes for species with FBD.

