
Figure 4. Path diagram showing evolutionary transition rates among four character states (Lawson Handley and Perrin’s dataset).
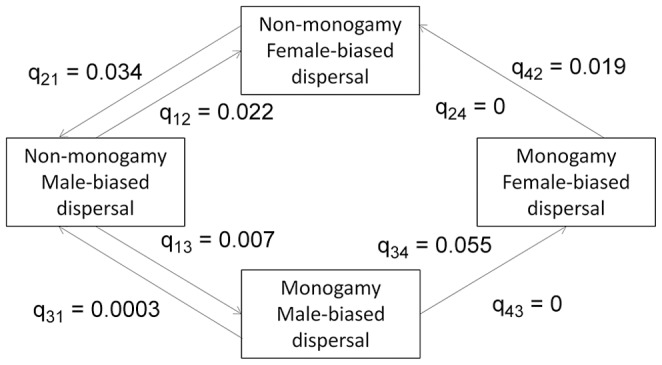
Transitions from the ancestral state of non-monogamy and MBD to the derived state of monogamy and FBD for mammals using Lawson Handley and Perrin’s dataset are shown. Arrow thickness is proportional to the magnitude of the transition rate.