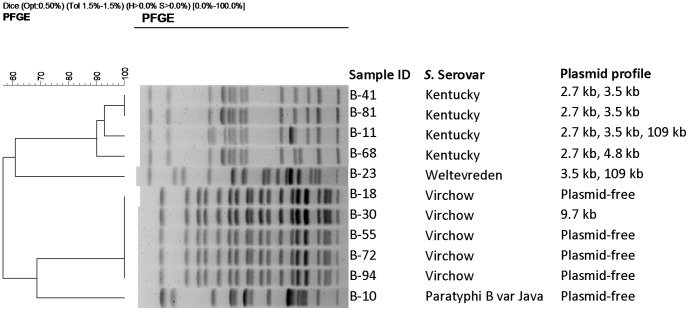
Figure 4. Dendrogram showing the cluster analysis on the basis of XbaI-PFGE of the 11 Salmonella isolates belonging to four serovars (S. Kentucky = 4, S. Virchow = 5, S. Paratyphi B var Java = 1 and S. Weltevreden = 1) obtained from a cross-sectional survey in commercial broiler poultry farms in Bangladesh, May – July, 2010.
Dice coefficient was used to perform similarity analysis, and clustering was performed by using unweighted pair-group method with arithmetic means (UPGMA) with 1.5% band position tolerance.

