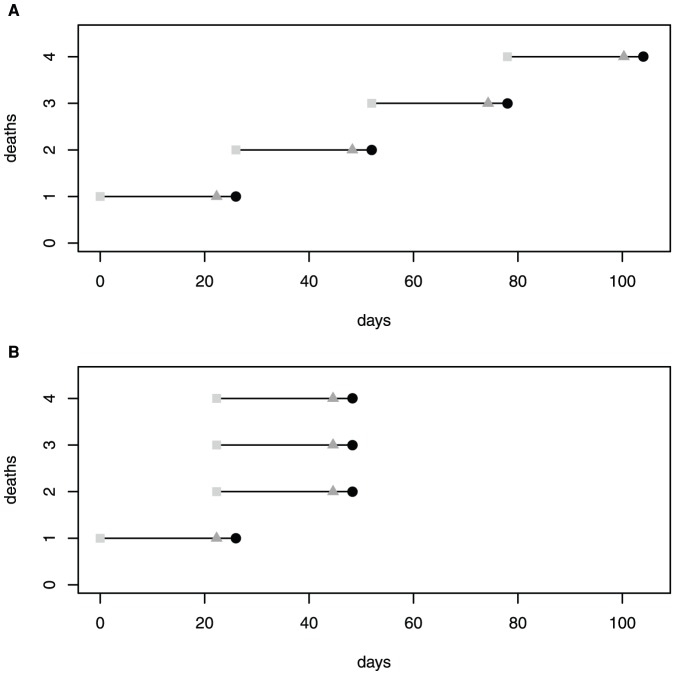
Figure 1. Outbreak schematic of our motivating assumption.
Schematic of two infection histories of the first four infected individuals in an outbreak illustrating the times of infection (light gray squares), transitions from incubation to infectious period (gray triangles), and death of infectious individuals (black circles). We hypothesize that minor outbreaks are more likely when intervals between death times are wide and the number of concurrently infected individuals is low (A) and major outbreaks should occur with higher probability when death times are clustered and several individuals may be simultaneously infected (B). A more realistic pattern of deaths would include increased variability in incubating and infectious periods.

