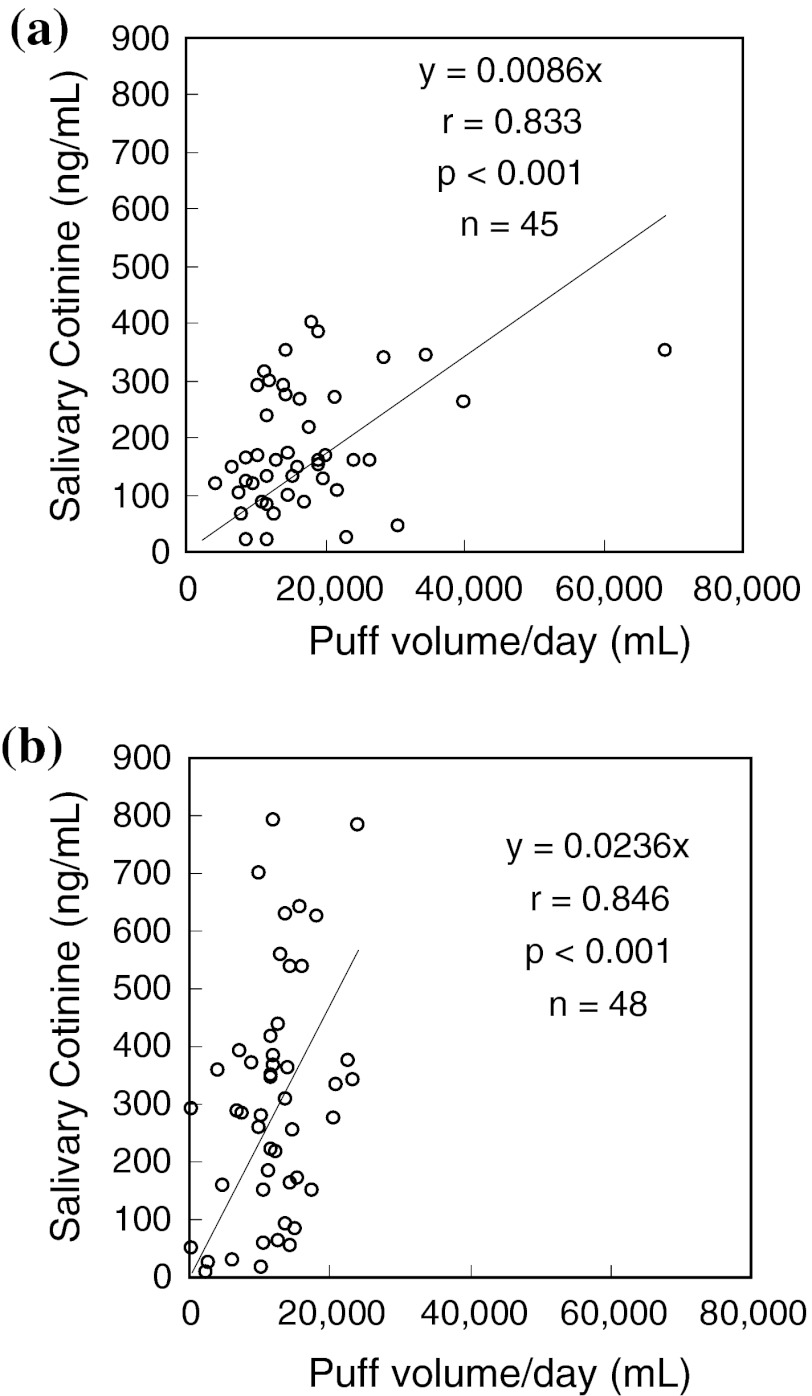
Fig. 3.
Correlation between puff volume/day and salivary cotinine for “ultra-low/low” nicotine yield smokers (a) and for “medium/high nicotine” yield smokers (b). Salivary cotinine concentrations were normally distributed whether or not they were log-transformed. When a subject [(x, y) = (68764.8, 351.4)] was excluded in a, regression parameters changed only slightly: y = 0.0097x, r = 0.845, p < 0.001, n = 44

