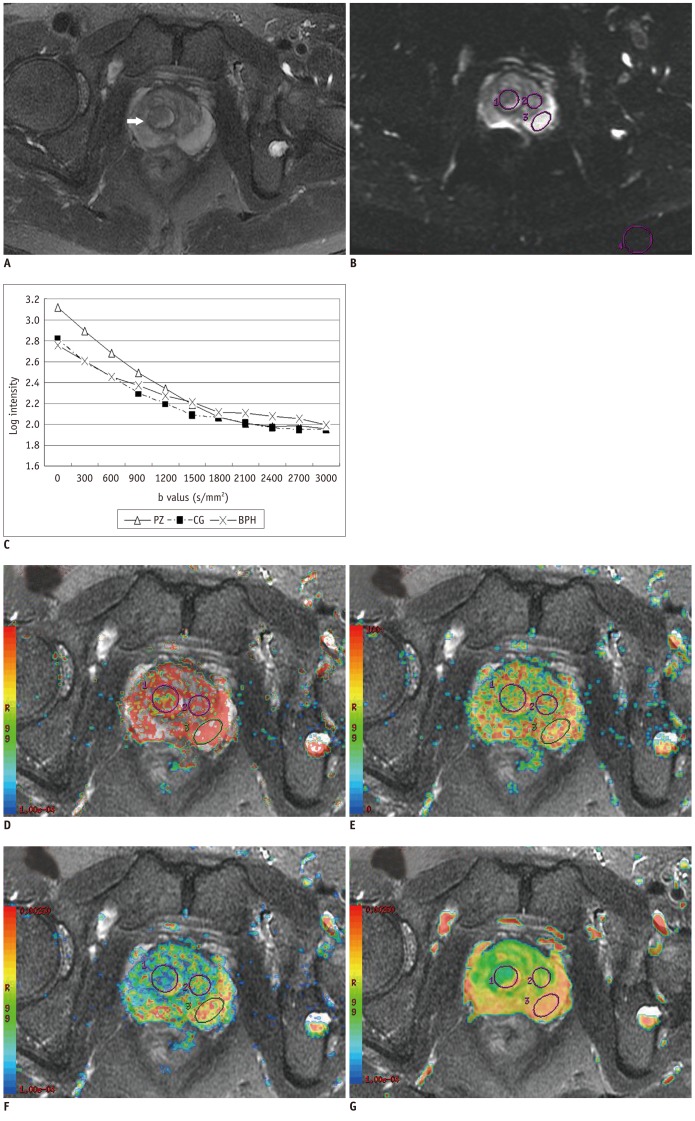
Fig. 2.
Signal of prostate BPH and normal tissue on DWI images at different b values and corresponding mono- and biexponential parameter maps.
A. Prostate glandular BPH in right CG (arrow) on T2-weighted image. B, C. Example ROIs on b = 0 s/mm2 image for BPH (right), normal CG (middle), PZ tissue (left) and noise (posterior) from same patient, and corresponding semi-log plots show typical signal decay vs. b-factor for BPH and normal tissue. Three tissues showed similar tendency of signal decay, although decay of BPH was slightly slower than normal tissue.
D-G. ADCf, f ADCs and ADC maps with T2-weighted image as background. ADCf, f, ADCs and ADC values of BPH (2.51 × 10⁻³ mm2/s, 54.4%, 0.84 × 10⁻³ mm2/s, 0.97 × 10⁻³ mm2/s) calculated from ROIs were lower than PZ (3.63 × 10⁻³ mm2/s, 78.2%, 1.17 × 10⁻³ mm2/s, 2.03 × 10⁻³ mm2/s) and CG (4.09 × 10⁻³ mm2/s, 59%, 1.36 × 10⁻³ mm2/s, 1.44 × 10⁻³ mm2/s). ADC = apparent diffusion coefficient, PZ = peripheral zone, CG = central gland, ROI = regions of interest, BPH = benign prostatic hyperplasia

