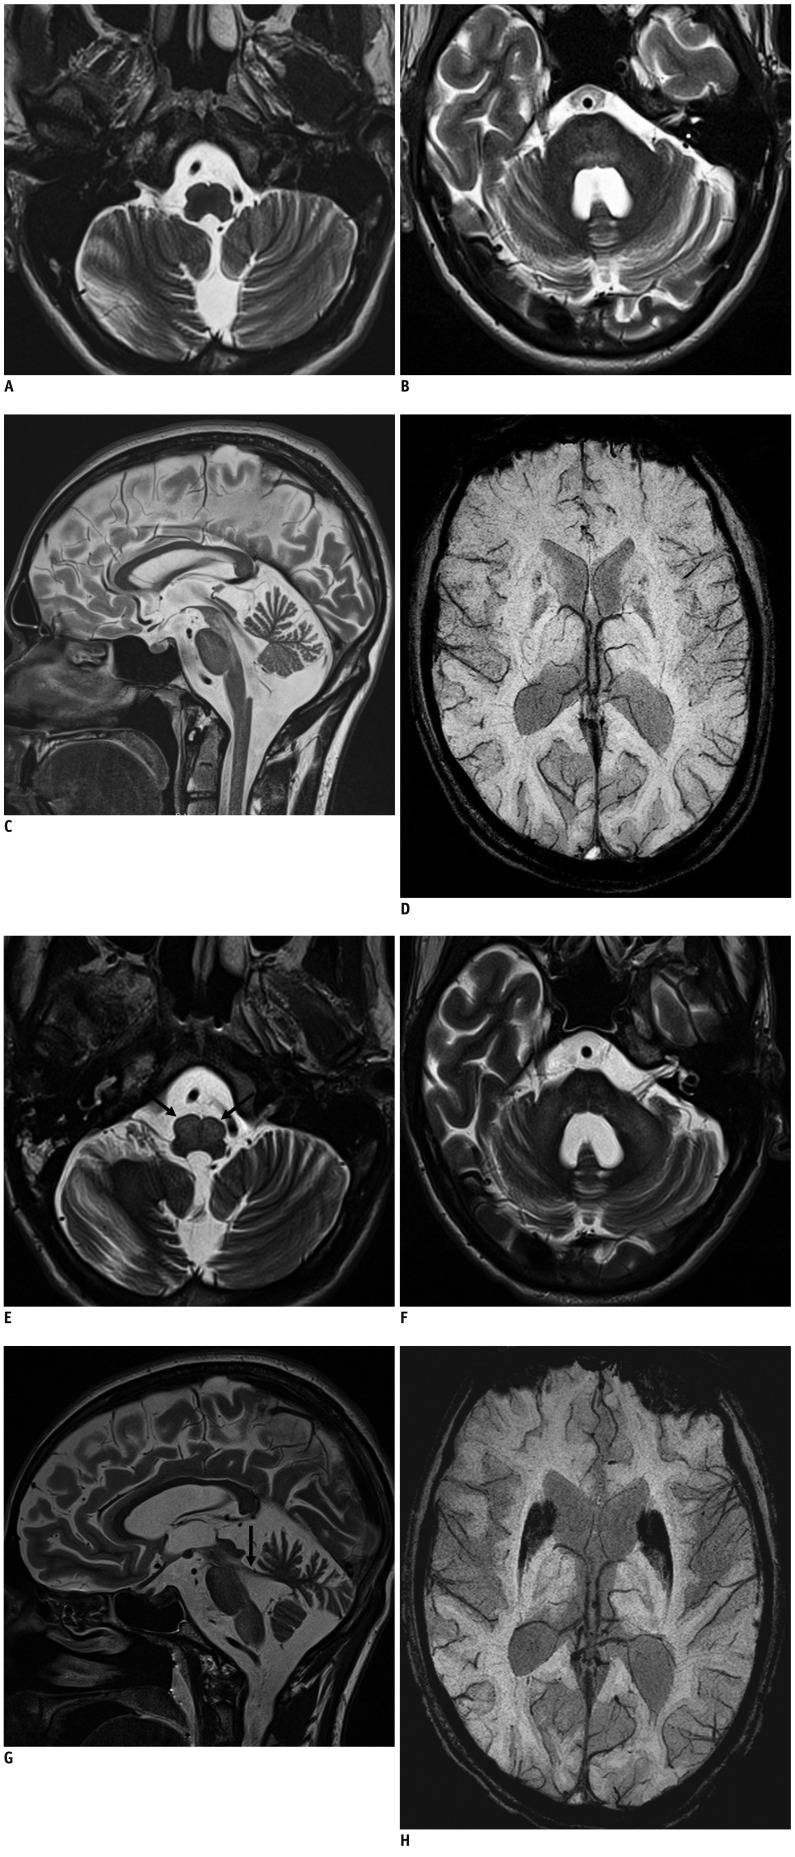
Fig. 1.
Bilateral hypertrophic olivary degeneration in Wilson disease (WD).
23-year-old man suffering from WD with initial MRI findings. A. Transverse T2WI (TR/TE: 6000/96 ms, FA = 120°) at level of medulla oblongata without signs of hypertrophy or increased signal intensity of inferior olivary nuclei on both sides. B. Transverse T2WI at level of pons: symmetrical hyperintensity of pontine tegmentum. C. Midsagittal T2WI: hyperintense midbrain with atrophy of cerebellum. D. Transverse SWI (TR/TE: 28/20 ms, FA = 15°) at level of basal ganglia shows low signal intensity of heads of caudate nuclei and putamina. SWI = susceptibility weighted image, T2WI = T2-weighted image
MRI findings of same patient one year later. E. Transverse T2WI (TR/TE: 6000/96 ms, FA = 120°) at level of medulla oblongata: bilateral hyperintense and hypertrophic inferior olivary nuclei (arrows). F. Transverse T2WI at level of pons: symmetrical hyperintensity and atrophy of medial cerebellar peduncles and pons. G. Parasagittal T2WI: hyperintense midbrain, pons, medulla; atrophy of superior cerebellar peduncle (arrow) and cerebellum. H. Transverse SWI (TR/TE: 28/20 ms, FA = 15°) at level of basal ganglia: considerable volume and ongoing signal loss in heads of caudate nuclei and putamina. SWI = susceptibility weighted image, T2WI = T2-weighted image

