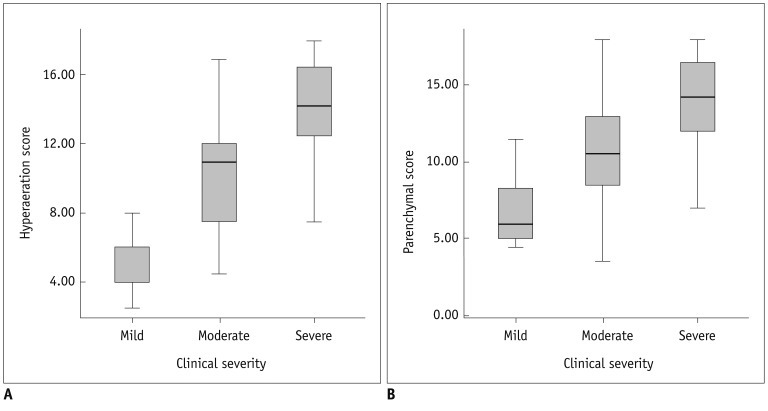
Fig. 3.
Correlation between hyperaeration and parenchymal scores of HRCT and clinical severity.
Hyperaeration score (A) shows significant correlation (r = 0.738, p < 0.001) with clinical severity. Parenchymal score (B) shows significant correlation (r = 0.523, p < 0.001) with clinical severity. Hyperaeration score shows better correlation with clinical severity than parenchymal score (p < 0.001). HRCT = high resolution computed tomography

