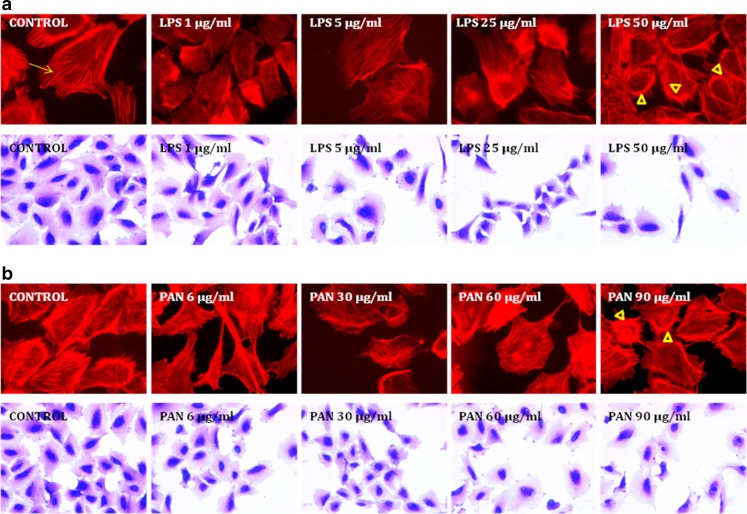
Fig. 2.
Effect of LPS or PAN on actin cytoskeleton and cell morphology. Control untreated podocytes show fine cytoplasmic F-actin stress fibers with F-actin phalloidin staining. Podocytes exposed to LPS or PAN show loss of fine F-actin stress fibers (arrow) and appearance of thick cortical distribution (arrowheads) at the highest concentration of each agent at the end of 24 h incubation with LPS or PAN (upper panels, 2A and 2B). The change in actin cytoskeleton reflected a change in cell morphology by crystal violet (0.1 %) staining (lower panels, 2A and 2B)

