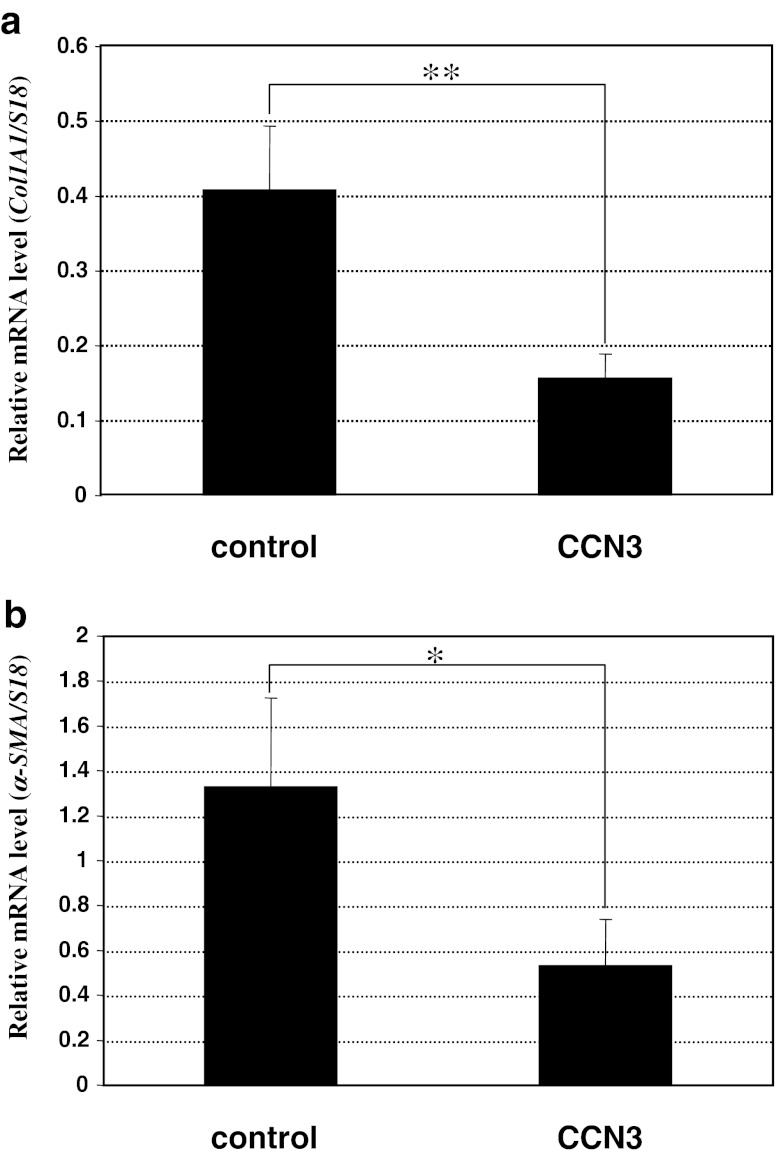
Fig. 2.
Repression of TGF-β-induced fibrotic phenotype of NIH3T3 cells by CCN3. Significant repression of the gene expression of 2 fibrotic markers, type I collagen (a) and α-SMA (b), was observed following CCN3 overexpression. Relative mRNA levels were computed by standardizing the values against those of 18 s ribosomal RNA. Evaluation was performed 3 times, and the mean values are given with error bars representing standard deviations. Difference between the data indicated by brackets are statistically significant at p < 0.05 (*) and p = 0.01 (**)

