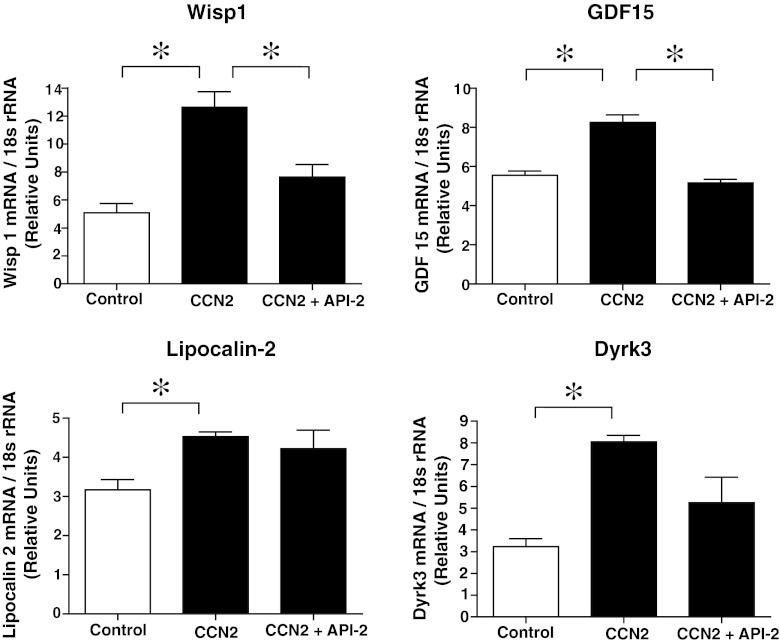
Fig. 11.
Histograms of quantitative real-time RT-PCR analyses of mRNA levels of WISP1, GDF15, Lipocalin-2, and DYRK3, relative to 18S rRNA levels in cardiac myocytes incubated for 48 h without rhCCN2, with 200 nmol/L rhCCN2, or with 200 nmol/L rhCCN2 in combination with 10 μmol/L API-2. Data are mean ± SEM, n = 3 in each group, *p < 0.05

