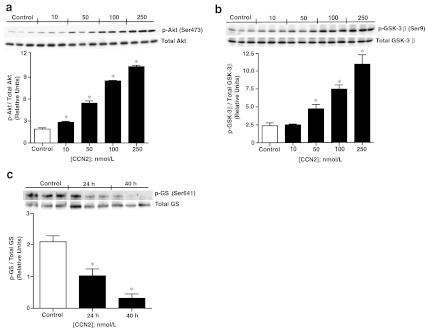
Fig. 2.

Activation of Akt/GSK-3β signaling pathway by CCN2. a Western blot analysis of phospho-Akt (Ser473) and b phospho-GSK-3β (Ser9) contents in cardiac myocytes stimulated with increasing concentrations of rhCCN2 for 30 min. c Western blot analysis of phospho-glycogen synthase (Ser641) levels in cardiac myocytes stimulated with 250 nmol/L rhCCN2 for 24 and 40 h. The histograms demonstrate densitometric analysis of phospho-protein levels relative to respective total protein contents. Data are mean ± SEM of n = 3 in each group, *p < 0.05 vs. control. The figure is representative of three independent experiments
