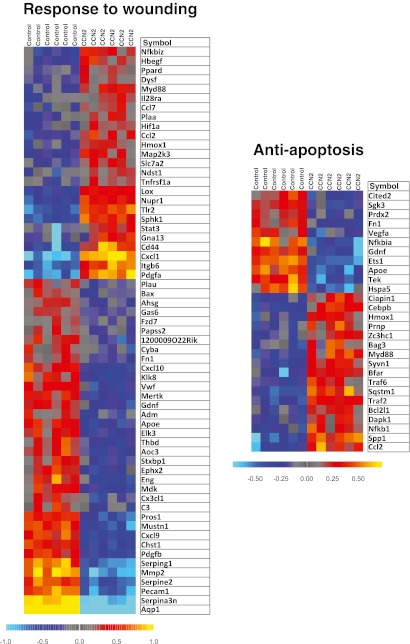
Fig. 9.
Heat maps illustrating relative expression levels of differentially expressed genes relating to the Gene Ontology terms “response to wounding” and “anti-apoptosis” in cardiac myocytes stimulated in the absence or presence of rhCCN2 (200 nmol/L) for 48 h. Yellow/red and blue colors indicate expression levels above and below average, respectively

