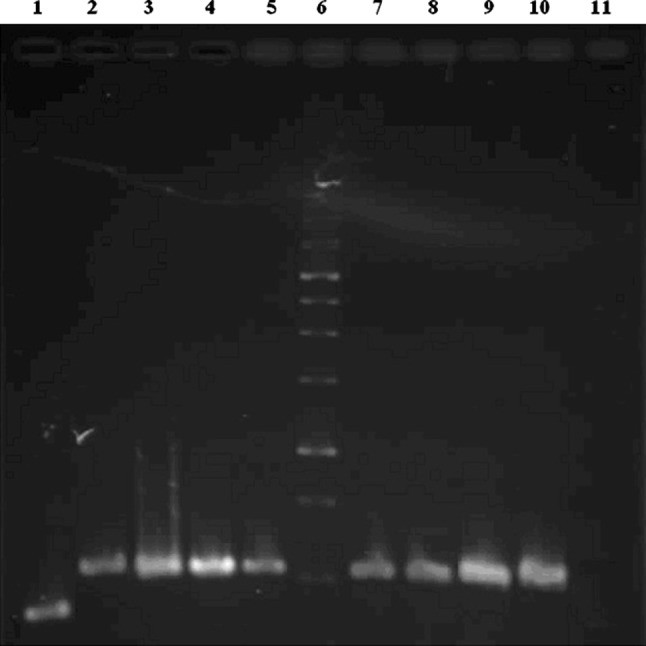
Fig. 1.

Gel electrophoresis image showing PCR products (from left to right): Lane 1 beta actin gene; Lane 2–5 positive placenta samples; Lane 6 molecular size marker; Lane 7–9 positive brain samples; Lane 10 positive control; Lane 11 negative control
