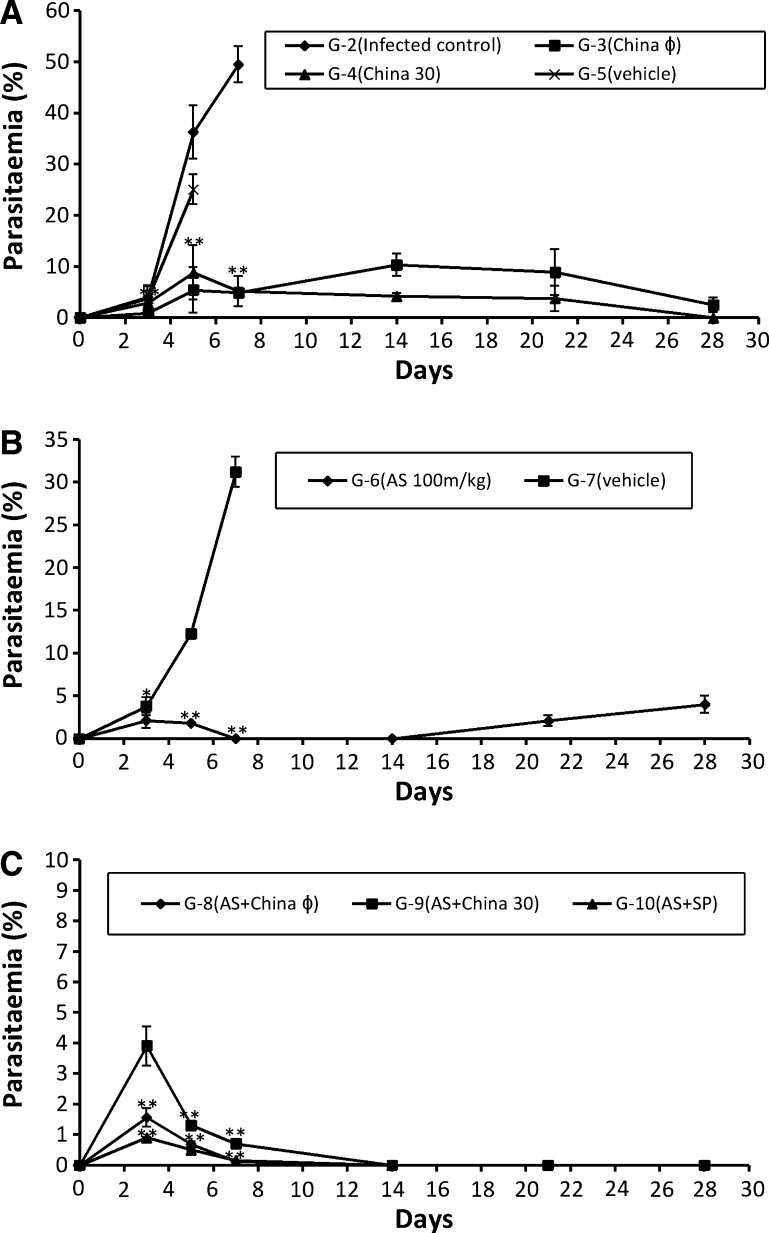
Fig. 1.
Graphs showing course of parasitaemia (Mean ± SD) in various experimental groups on various days of study. Data is given as mean ± SD. p < 0.05 (# statistically significant), p value in comparison to infected control is represented as p < 0.005 (* statistically highly significant), p < 0.0005 (** statistically extremely significant). a Course of parasitaemia in groups treated with monotherapy of china (G-3 and G-4) and placebo control (G-5). b Course of parasitaemia in groups treated with monotherapy of artesunate (G-6) and vehicle treated group (G-7). c Course of parasitaemia in groups treated with combination therapy (G-8, G-9) and positive control group (G-10)

