
Table 5.
ECHO data from MPS VI subjects during galsulfase trials
| Echo parameter | Baseline (n = 54) | 24–48 weeks (n = 53) | 72–96 weeks (n = 52) | p-value (based on repeated measures model comparing all three time points) |
|---|---|---|---|---|
| LVED mean z-score | −0.16 ± 1.25 (n = 54) | 0.11 ± 1.17 (n = 53) | −0.10 ± 1.15 (n = 51) | 0.150 |
| LVES mean z-score | −0.74 ± 1.40 (n = 54) | −0.28 ± 1.37* (n = 52) | −0.53 ± 1.30 (n = 51) | 0.034 |
| SF (%) | 42.20 ± 6.63 (n = 54) | 40.35 ± 6.65 (n = 53) | 40.40 ± 8.11 (n = 51) | 0.208 |
| LVPWd mean z-score | 1.86 ± 0.99 (n = 53) | 1.62 ± 1.94 (n = 53) | 1.64 ± 0.97 (n = 51) | 0.551 |
| IVSd mean z-score | 1.57 ± 0.95 (n = 54) | 1.14 ± 0.86* (n = 53) | 0.97 ± 0.89* (n = 51) | <0.0001a |
| AoPSG (mmHg) | 13.72 ± 10.78 (n = 34) | 11.78 ± 6.89 (n = 37) | 12.99 ± 9.00 (n = 34) | 0.150 |
| MMV (mmHg) | 7.28 ± 5.68 (n = 32) | 7.75 ± 6.63 (n = 34) | 7.13 ± 5.64 (n = 30) | 0.552 |
| Aortic regurgitation | 0.53 ± 0.87 (n = 54) | 0.73 ± 0.97* (n = 53) | 0.88 ± 0.99* (n = 50) | 0.004b |
| Mitral regurgitation | 1.35 ± 1.01 (n = 51) | 1.42 ± 0.89 (n = 51) | 1.51 ± 0.73 (n = 47) | 0.459 |
LVED Left ventricular chamber dimension in diastole, LVES left ventricular chamber dimension in systole, SF shortening fraction, LVPWd diastolic left ventricular posterior wall thickness, IVSd diastolic intraventricular septal thickness, AoPSG aortic peak systolic gradient, MMV mean mitral valve gradient
*p < 0.05 compared to baseline
aWe observed a significant time versus group interaction (p = 0.0396) for IVSd. Data shown in Figure A as mean ± SD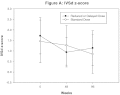
bWe observed a significant time versus group interaction (p = 0.019) for aortic regurgitation. Data shown in Figure B as mean ± SD