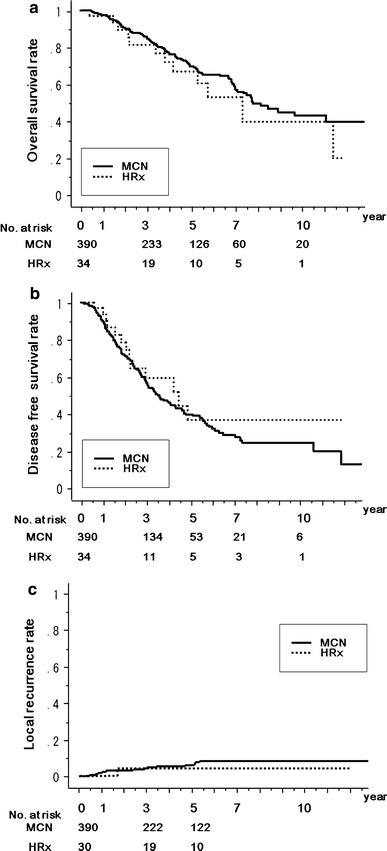
Fig. 2.

Comparison between MCN group (n = 390, solid line) and hepatic resection (HRx) group (n = 34, dotted line) in patients with ≤3 lesions ≤3 cm in diameter. a Kaplan–Meier estimation of overall survival, P = 0.3592. b Kaplan–Meier estimation of disease-free survival, P = 0.3496. c Kaplan–Meier estimation of local recurrence rate, P = 0.5926. The number of patients at risk at each time point is shown below the graphs
