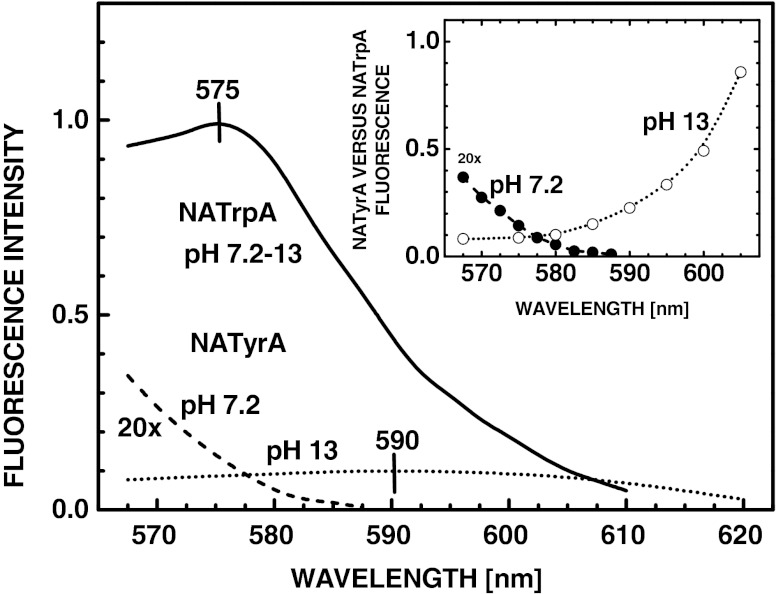
Fig. 2.
Two-photon excitation spectra of the neutral (pH 7.2, λem 313 nm) (- - -) and anionic (pH 13, λem 350 nm) (• • •) forms of NATyrA relative to that for NATrpA (λem 350 nm) (____). Intensity of NATrpA fluorescence for 2PE at 575 nm is normalized to unity. The inset shows relative two-photon cross sections calculated as relation between the fluorescence intensities of the neutral (__•__) and anionic (. . . ○ . . .) forms of NATyrA, and that for NATrpA measured in the same experimental arrangement

