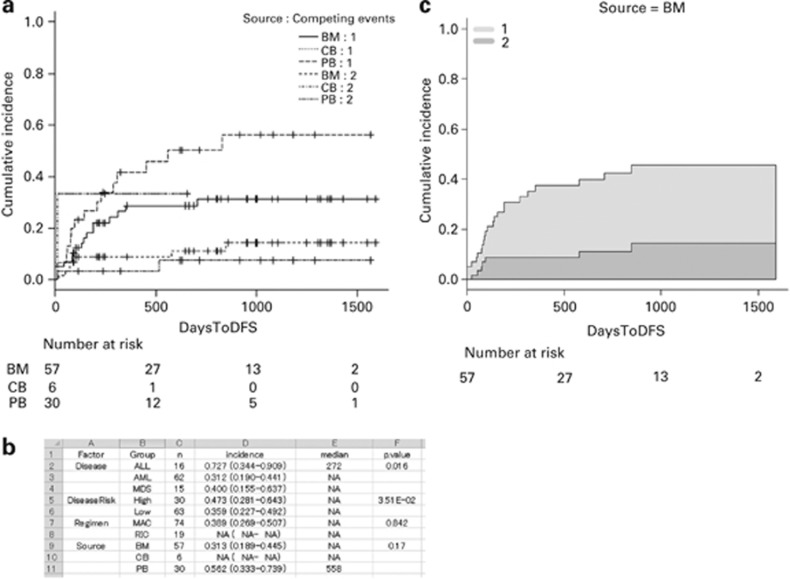
Figure 6.
(a) Cumulative incidence curves of relapse (event=1) and non-relapse mortality (event=2) grouped according to the stem cell source. (b) Summary of the cumulative incidence analyses copied to the clipboard and then pasted into a spreadsheet. (c) Stacked cumulative incidence graph. The light gray area indicates the incidence of relapse (event=1) and the dark gray area indicates the incidence of non-relapse mortality (event=2).

