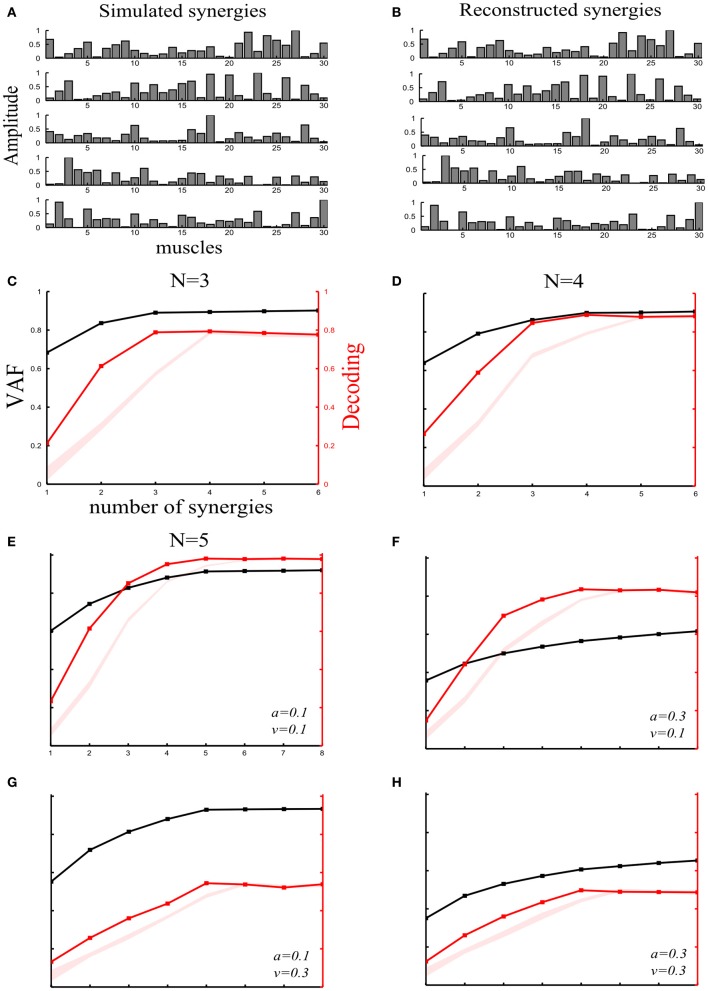
Figure 2.
Robustness of our method applied to synchronous synergies when varying the number of “ground-truth” synergies and the sources and levels of noise. (A) Set of five simulated synchronous synergies used as the “ground-truth” for testing our method. (B) The five synergies recovered when the NMF algorithm was applied to the simulated EMG data. In all cases, the original synergies were accurately reconstructed. (C–E) VAF (black curves whose scale is indicated in left y-axes) and decoding performance curves (red curves whose scale is indicated in right y-axes) for datasets generated from 3(C), 4(D), and 5(E) “ground-truth” synergies. For noise levels, we used the “reference” values (a = 0.1 and v = 0.1). The red shaded areas represent the 5–95% confidence intervals of the bootstrap test for decoding. (F–H) VAF and decoding performance curves [plotted with the same conventions as in panels (C–E)] when generating data from five synergies and varying the simulated noise parameters as follows: increased signal-dependent noise (a = 0.3, v = 0.1) (F); increased trial-by-trial variability of the activation coefficients (a = 0.1, v = 0.3) (G); increased signal-dependent noise and trial-by-trial variability of the activation coefficients (a = 0.3, v = 0.3) (H).

