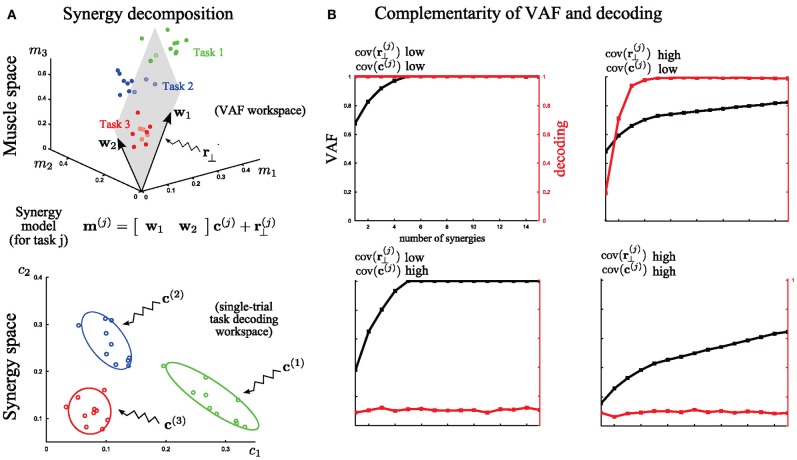
Figure 4.
A simple illustration of problems faced in assessing the quality of muscle synergy models. (A) Top: Identification of 2 muscle synergies (w1 and w2) from the activities of 3 muscles executing 3 motor tasks. The 3-dimensional muscle space is approximated by a linear 2-dimensional synergy space. Bottom: Distributions of the synergy activation coefficients across trials for the three tasks. The variability of these distributions determines how reliably synergy recruitment maps onto task accomplishment. (B) Illustration of the behavior of VAF (black curves and left y-axes) and decoding performance (red curves and right y-axes) as a function of the number of extracted synergies under four cases of extreme (either high or low) levels of variability. The dataset was generated by combining five synchronous synergies. These examples indicate that the two metrics assess the role of two different types of variance in the dataset.

