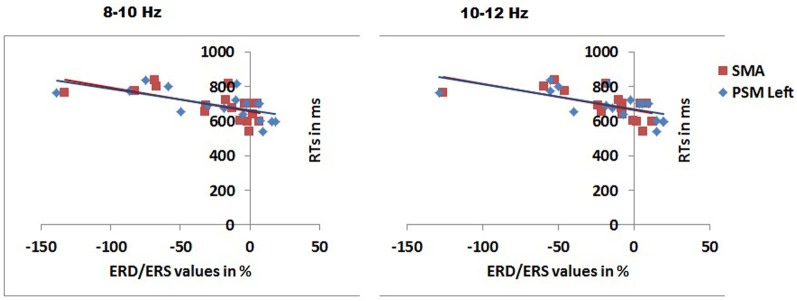
Figure 6.

Scatter plots with the best fitting linear lines showing significant correlations between RTs for congruently gripped objects and mu rhythm ERD/ERS over different scalp regions in 8–10 and 10–12 Hz frequency band in the 0–100 ms time window after stimulus presentation. PSM, primary sensory motor area; SMA, supplementary motor area.
