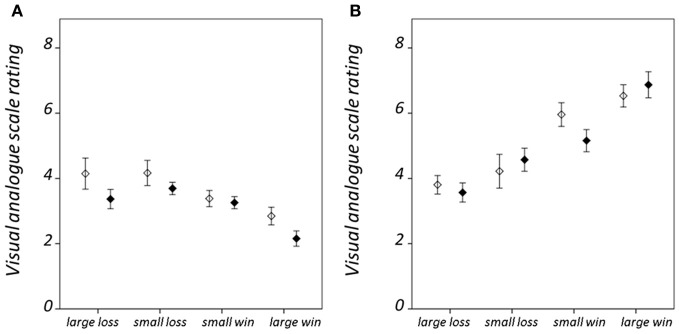
Figure 3.
Condition-specific visual analog scale (VAS) rating results. For (A) hit trials, and (B) miss trials. VAS ratings range between 1 when the participant reported feeling “satisfied” and 9 when “dissatisfied.” Error bars denote standard error of the mean. Healthy group results are shown in black and schizophrenia group results in white.

