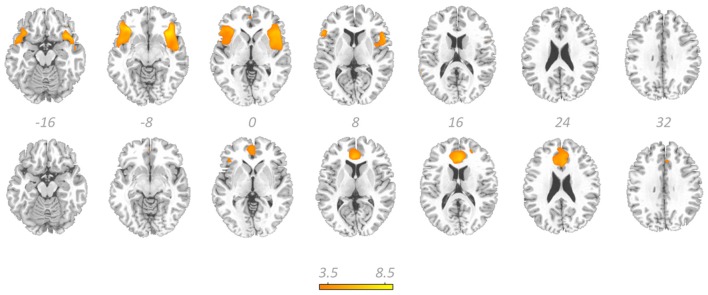
Figure 5.
The salience network. Showing the best-fit frontoinsular cortex component (top row) and the best-fit anterior cingulate cortex component (bottom row) overlaid on a standardized T1-weighted image. Colorbar denotes T-scores from one sample T-tests and relates to both components. These images are thresholded at uncorrected P-threshold of 0.001.

