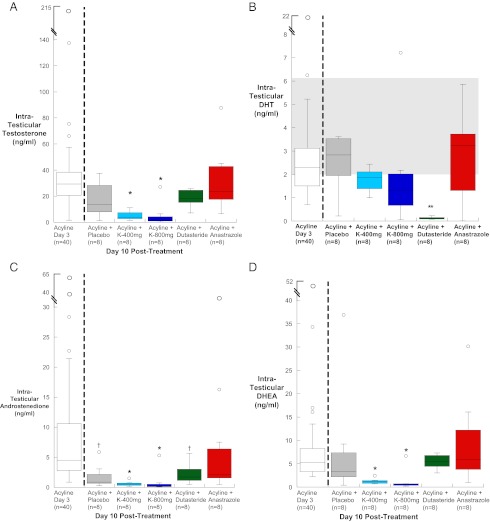
Figure 2.
A–D, Box plots of IT-T (A), IT-DHT (B), IT-ADD (C), and IT-DHEA (D) in gonadotropin-suppressed subjects on day 3 and day 10 by treatment group. Baseline median (25th and 75th percentiles) IT-T concentration for normal men is 715 (486, 1000) ng/mL (19). The baseline median IT-DHT concentration for normal men is shown in gray shaded area (19). The baseline median IT-ADD and IT-DHEA concentrations for normal men are 179 (88, 246) ng/mL and 162 (118, 253) ng/mL, respectively (23). K400, ketoconazole 400 mg; K800, ketoconazole 800 mg; * P < .05 compared with day 3 and all nonketoconazole treatment groups;**P < .05 compared with day 3 and all other treatment groups; †P < .05 compared with day 3.

