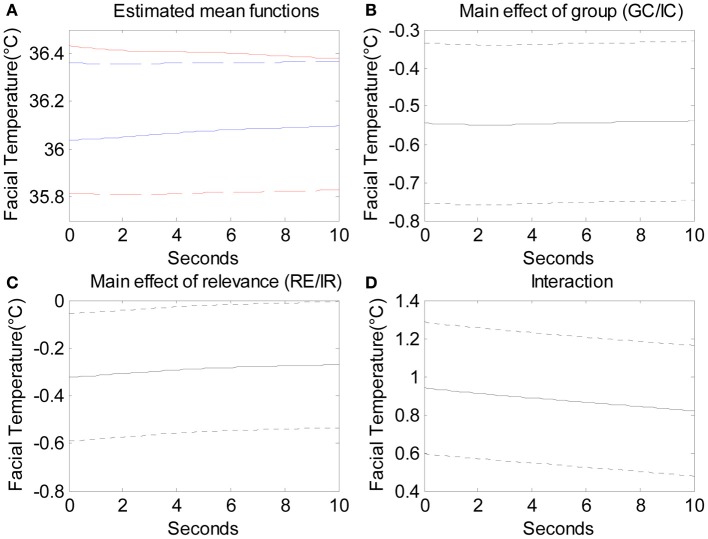
Figure 7.
The estimated mean functions of the four conditions. From the top, solid red line indicates the mean function of GC-RE, blue dashed line IC-IR, blue solid line IC-RE, and red dashed line GC-IR. (B) The main effect of condition (GC/IC; solid line) with 95% pointwise confidence interval (dotted lines). (C) The main effect of relevance (solid line) with 95% pointwise confidence interval (dotted lines). (D) The interaction effect of condition and relevance (solid line) with 95% pointwise confidence interval (dotted lines).

