. 2013 Jan-Mar;29(1):71–75. doi: 10.4103/0970-9185.105807
Copyright: © Journal of Anaesthesiology Clinical Pharmacology
This is an open-access article distributed under the terms of the Creative Commons Attribution-Noncommercial-Share Alike 3.0 Unported, which permits unrestricted use, distribution, and reproduction in any medium, provided the original work is properly cited.
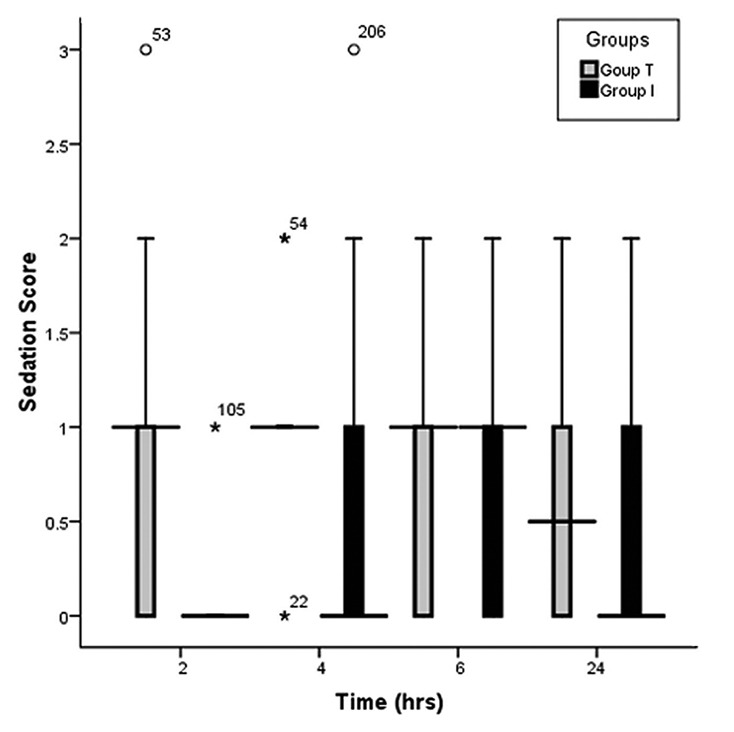
Figure 2.

Sedation scores comparison between Group T and Group I
