
Figure 2.
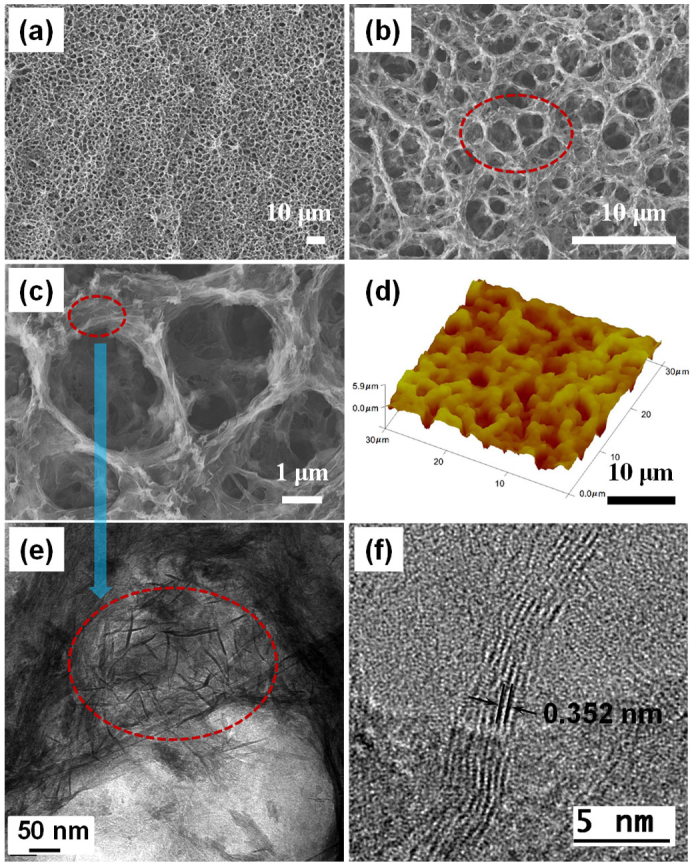
The morphology of the 3-D SFG structure: (a) – (c) Low and high-magnification of SEM image of SFG.(d) AFM image of SFG. (e) HRTEM image on the junction of the pores. (f) HRTEM image for RGO platelets.
Official websites use .gov
A
.gov website belongs to an official
government organization in the United States.
Secure .gov websites use HTTPS
A lock (
) or https:// means you've safely
connected to the .gov website. Share sensitive
information only on official, secure websites.
The morphology of the 3-D SFG structure: (a) – (c) Low and high-magnification of SEM image of SFG.(d) AFM image of SFG. (e) HRTEM image on the junction of the pores. (f) HRTEM image for RGO platelets.