
Figure 10.
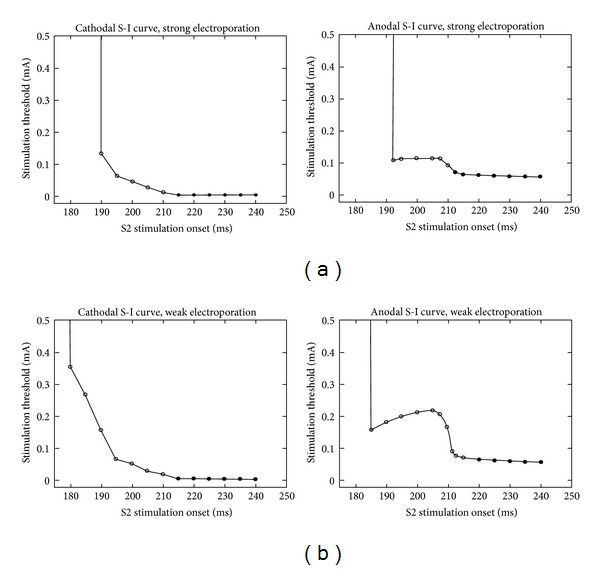
The calculated cathodal and anodal strength-interval curve for S2 pulse duration of 10 ms for strong (a) and weak (b) electroporation current. Open and filled circles denote break and make stimulation responses, respectively [49].
Official websites use .gov
A
.gov website belongs to an official
government organization in the United States.
Secure .gov websites use HTTPS
A lock (
) or https:// means you've safely
connected to the .gov website. Share sensitive
information only on official, secure websites.
The calculated cathodal and anodal strength-interval curve for S2 pulse duration of 10 ms for strong (a) and weak (b) electroporation current. Open and filled circles denote break and make stimulation responses, respectively [49].