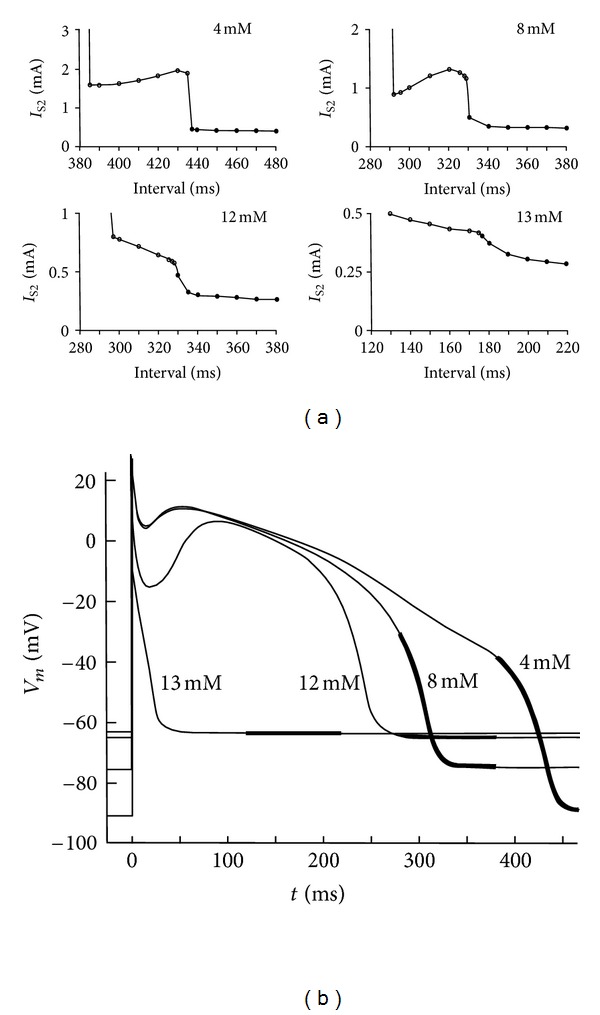
Figure 6.

(a) The calculated anodal strength-interval curve for an S2 pulse duration of 20 ms and extracellular potassium concentrations of 4, 8, 12, and 13 mM. Open circles indicate break excitation and filled circles indicate the make excitation. (b) The transmembrane potential as a function of time for extracellular potassium concentrations of 4, 8, 12, and 13 mM. The thick section of each curve indicates the time for which the strength-interval curves are calculated in (a) [30].
