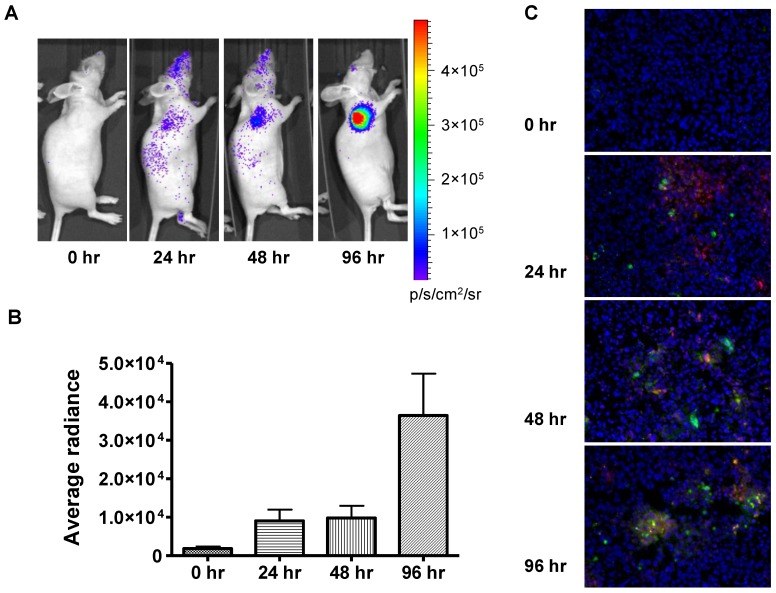
Figure 5.
In vivo bioluminescence imaging of caspase activation in 22B-pcFluc-DEVD tumors after doxorubicin treatment. (A) Representative bioluminescent images of mice treated with one dose of doxorubicin (5 mg/kg). (B) Quantification of BLI signal over tumor region. (C) TUNEL staining of tumor sections (Magnification 20×). Red color represents doxorubicin and green color represents positive TUNEL staining. Blue color is from DAPI, a dye for staining nuclei.

