Figure 6.
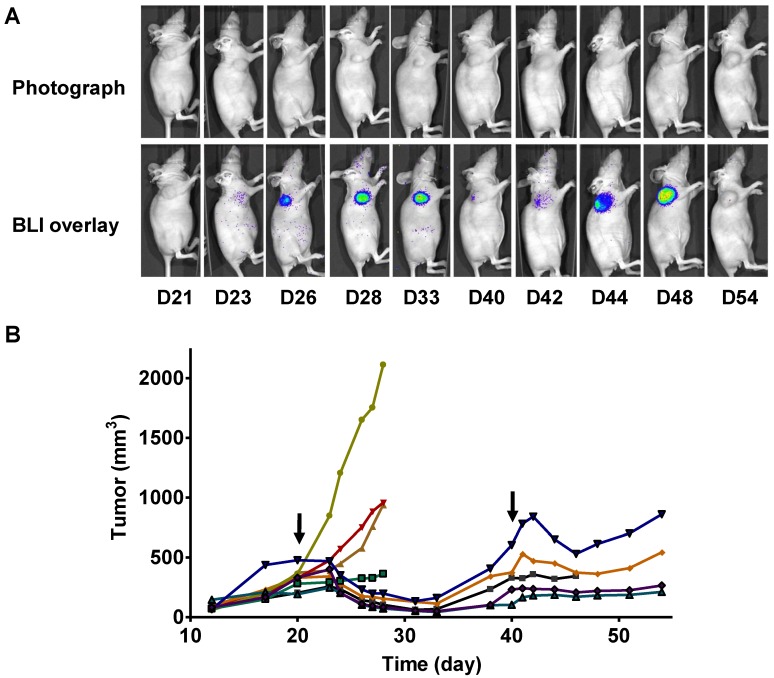
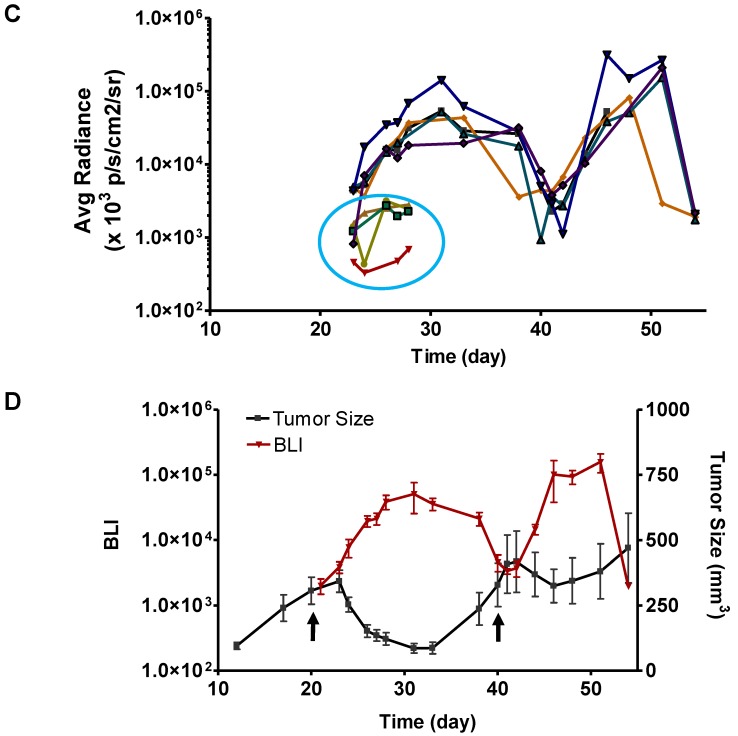
Longitudinal bioluminescence imaging of caspase activation in 22B-pcFluc-DEVD tumors after Doxil treatment. (A) Representative photographic images overlaid with bioluminescence images of 22B-pcFluc-DEVD tumor-bearing mice treated with two doses of Doxil (5 mg/kg each). (B) Tumor size decreases and then rebounds after Doxil treatment. The arrows designate administration of Doxil. (C). BLI signal changes along with time in response to Doxil treatment. The curves in the circle are representative of the control mice treated with PBS. (D) Average tumor growth curve and BLI changes along with time and have reverse correlation in response to Doxil treatments.


