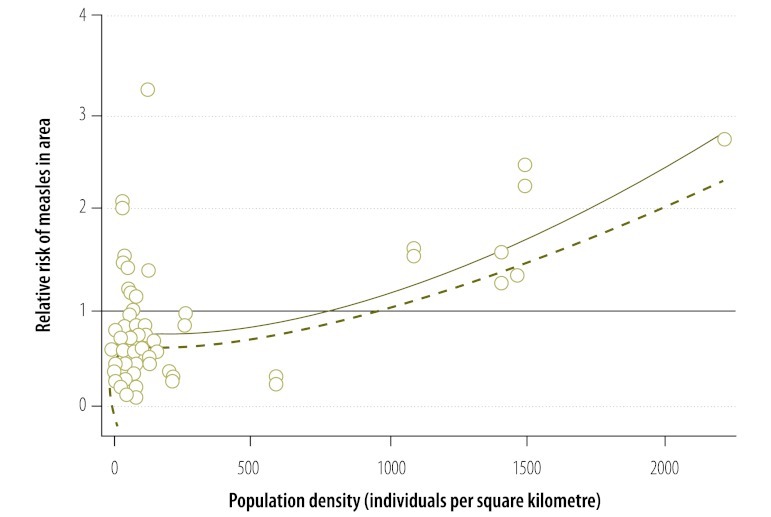
Fig. 7.
Relative risk of measles in infants, by district population density, South Africa, 2009–2011
The circles indicate the observed relative risk and population density in individual districts.
The solid line represents the fitted association between the observed relative risk and population density and the dashed line represents the lower bound of the 95% confidence interval for the association.

