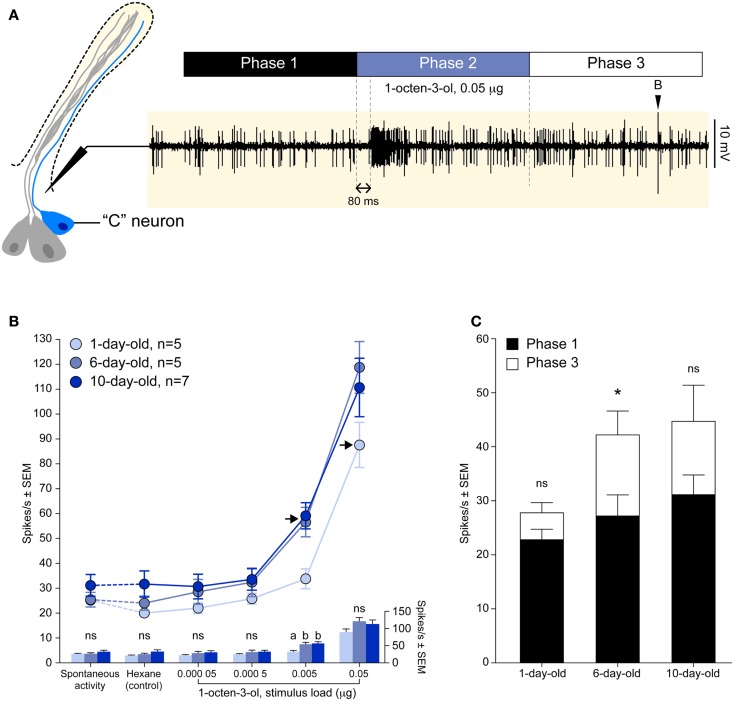
Figure 2.
Physiological development of the octenol receptor neuron. (A) Diagram outlining the methodology used to record action potentials of the “C” neuron in response to 1 s exposure of CO2-free air, hexane, or octenol (phase 2). A delay of 80 ms was observed between stimulation and the response. The use of CO2-free air allowed for the unobstructed observation of medium (inverted black triangle) and small-sized spikes, the latter being elicited by octenol. (B) Dose-dependent curves of mean octenol responses from the “C” neuron of 1, 6, and 10 days old adult female mosquitoes. Points represented are mean ± SEM (n = 5–7). Responses to octenol were compared to hexane control using a one-way ANOVA followed by Dunnett’s post test (***P < 0.001; **P < 0.01; ns, not significant). Detection threshold for 1 day old and 6/10 days old insects was 0.05 and 0.005 μg, respectively (black arrows). The histograms below shows the comparison of the mean responses for each concentration (one-way ANOVA followed by Tukey’s multiple comparison post test, P < 0.05; ns, not significant). (C) The rate of spontaneous activity pre-stimulation (phase 1) and post-stimulation (phase 3) showed a significant change for 6 days old insects (Student t test, *P < 0.05; ns, not significant).

