Figure 7.
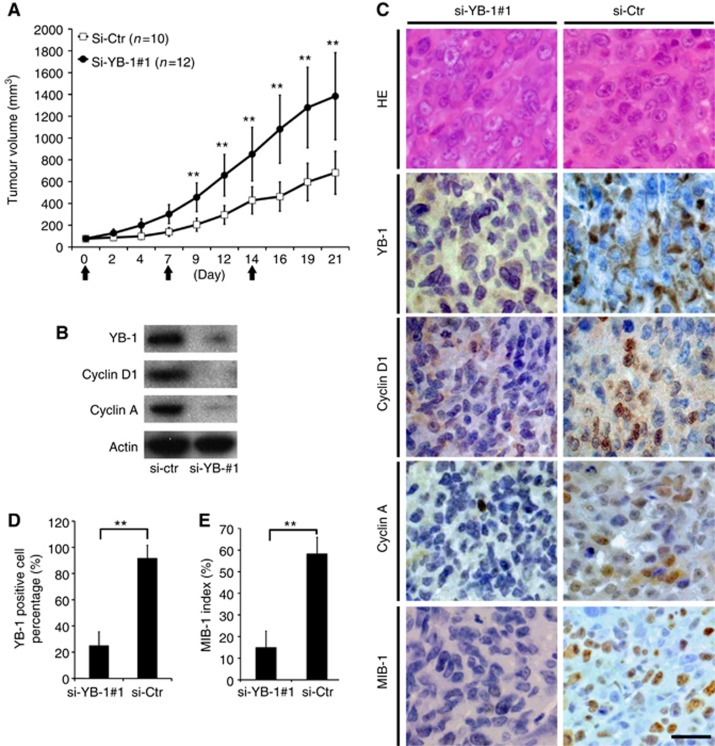
Inhibition of tumour growth by si-YB-1 with atelocollagen in the MNNG xenograft model. (A) Tumour growth curves after treatment with si-YB-1#1 or si-Ctr with atelocollagen. Each therapeutic reagent was injected into the tumours on days 0, 7, and 14 (arrows). Data are expressed as the mean±s.d. (n=12 for YB-1, n=10 for Ctr). **P<0.01, when si-YB-1#1 was compared with si-Ctr. (B) Levels of YB-1, cyclin D1, and cyclin A in tumours were analysed by immunoblotting. Actin was used for internal normalisation. (C) Representative micrographs of haematoxylin−eosin staining and immunohistochemical detection of YB-1, cyclin D1, cyclin A, and MIB-1 in tumours treated with si-YB-1#1(left) or si-Ctr (right). Scale bar; 20 μm (D and E). The number of cells expressing YB-1 (D) and MIB-1 (E) was scored in five independent areas. The percentage of YB-1- or MIB-1-positive cells was then calculated. Data are expressed as the mean±s.d. **P<0.01 si-YB-1#1 vs si-Ctr.

