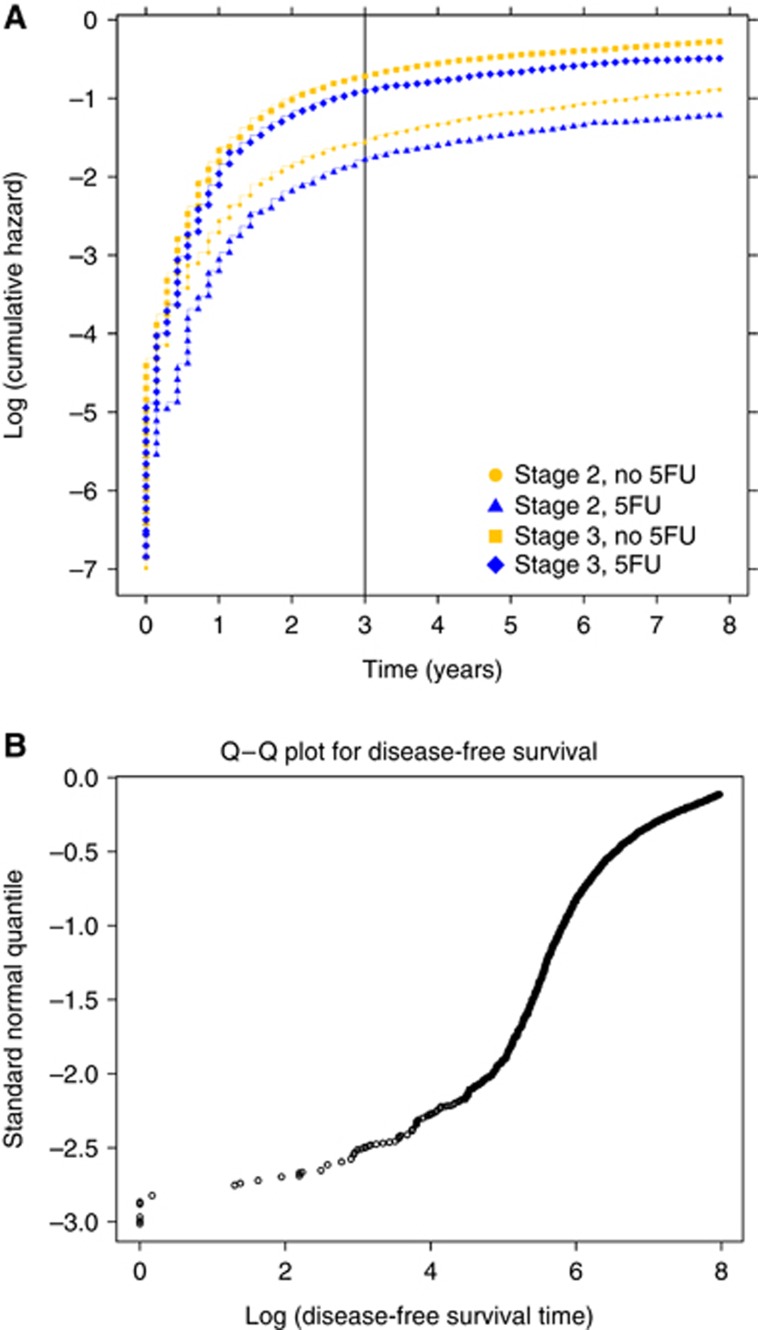
Figure 1.
(A) Disease-free survival risk for male subjects aged 60–65 years by treatment and stage: plot depicts log of cumulative hazard by treatment, with or without 5FU, for stage II and III patients, to examine Cox model assumption of proportional hazards. (B) Disease-free survival quantile–quantile plot for male subjects: plot is a normal probability plot for log of disease-free survival event times, to examine the assumption that the logarithm of disease-free survival times has a normal distribution.

