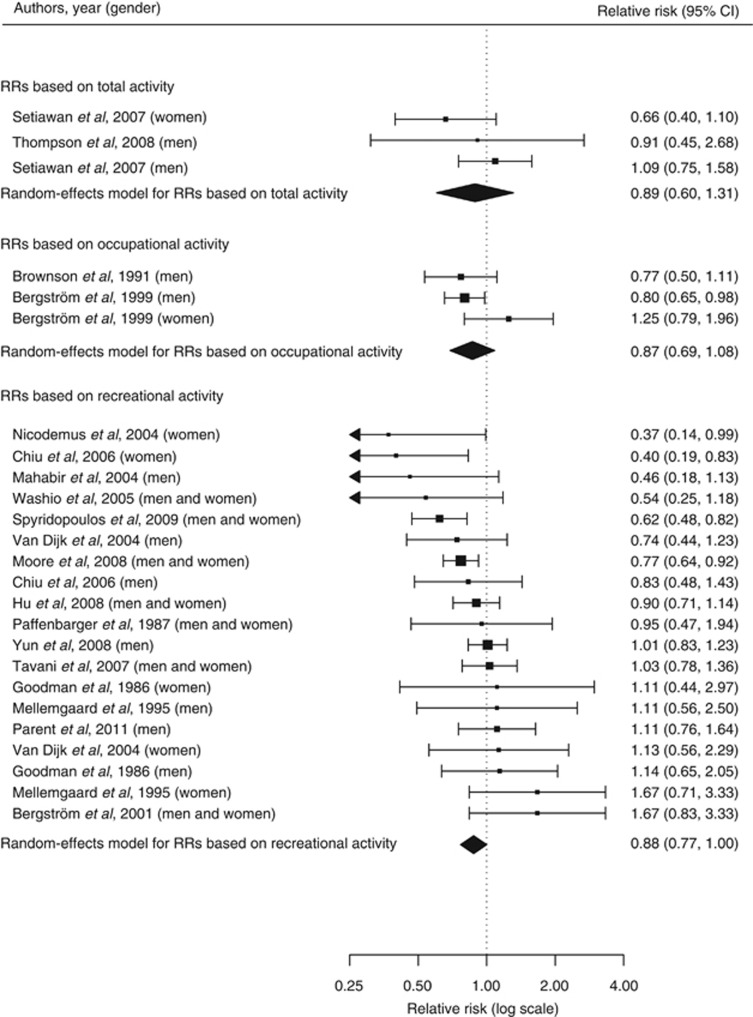
Figure 2.
Forest plot corresponding to the main random-effects meta-analysis including 25 risk estimates quantifying the relationship between high physical activity and renal cancer risk. Relative risks (RRs) compare high vs low levels of physical activity and are grouped by physical activity domain. The size of the box representing each risk estimate is proportional to the weight that the risk estimate contributed to the summary risk estimate.

