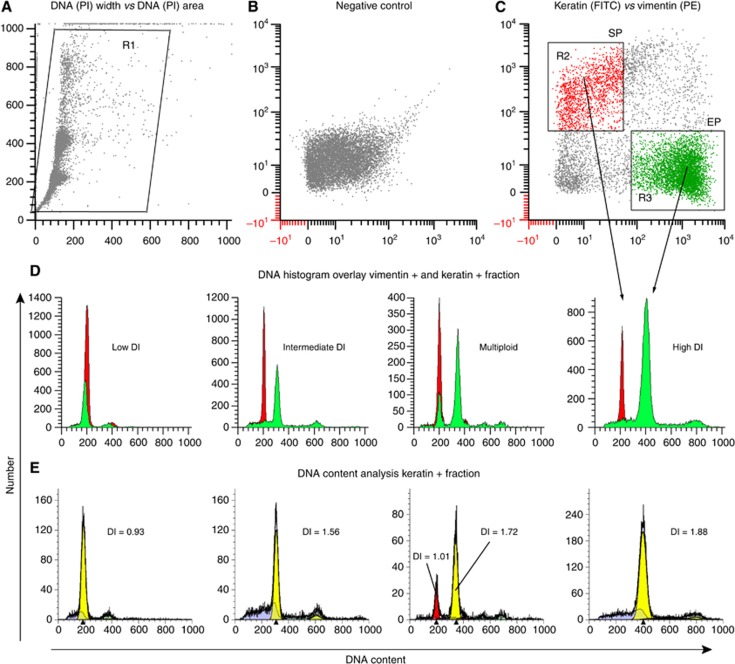
Figure 1.
The four DNA content categories based on multi-parametric analysis. (A) Dot plot showing doublet discrimination to ensure analysis of a single cell population. (B) PI-positive cells as a negative control. (C) Dot plot showing keratin-positive epithelial cell population (EP), and vimentin-positive stromal cell population (SP). (D) DNA content histograms showing an example of a low DI, intermediate DI, high DI, and a multiploid tumour. The epithelial tumour cell population (green) is shown overlapping the normal stromal cell population (red) is shown. Histograms in (E) show the mathematical modelling analysis using the ModFit algorithm. The color reproduction of this figure is available at the British Journal of Cancer journal online.

