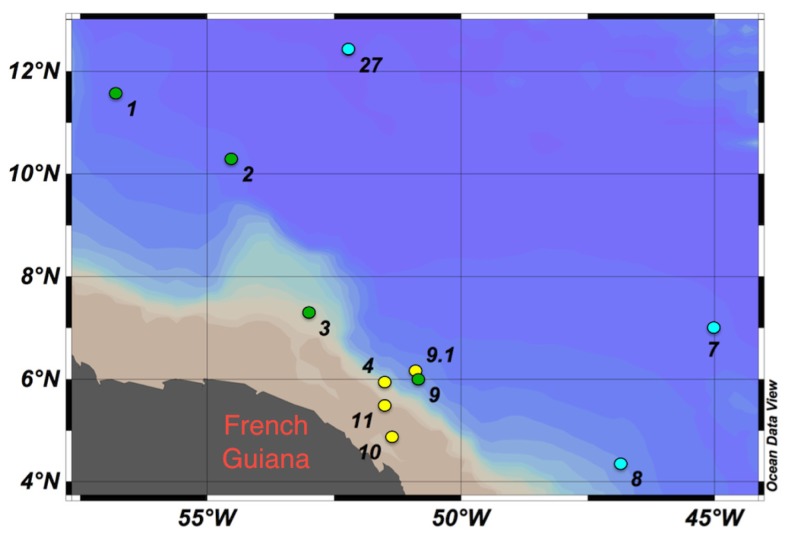
FIGURE 1.
Study sites in the western tropical North Atlantic (WTNA) Ocean with degrees latitude north and degrees longitude west shown. Stations clustered by sea surface salinity (SSS): low-salinity stations (SSS < 30, yellow circles), mesohaline stations (30 <SSS>35, green circles), and oceanic/open ocean stations (SSS > 35, blue circles). Ocean data view (Schlitzer, 2011).

